
WPC: Q2 2023 Update & Some Net Lease Lessons
W.P. Carey (WPC) tightened guidance for AFFO and maintained other guidance. It should be the simplest update to write, but it’s been a while since we wrote on WPC. We’ll give it a deeper look.
While this article is focused entirely on WPC, it will dive into several factors that drive the net lease sector. I could write a similar article about Realty Income (O), National Retail Properties (NNN), Agree Realty (ADC), and Four Corners Property Trust (FCPT). The numbers would be different, but the same macro elements are impacting the entire sector.
By different, I only mean slightly different. AFFO per share growth is looking pretty similar.
The REIT Forum is a reader-supported publication. To receive new posts and support my work, consider becoming a free subscriber.
Guidance Update
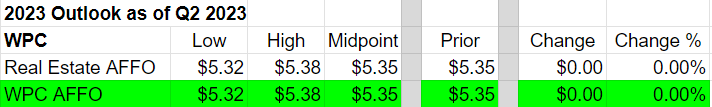
I prepared the following table to highlight key metrics:
Net lease REITs tend to have fewer numbers for guidance. In general, they tend to be the simplest type of equity REIT. Relative to other net lease REITs, WPC was more complex. The complexity was due to having an “investment management” section. That’s no longer an issue, but it can still complicate some historical measurements.
Types of AFFO
WPC provides guidance on two FFO metrics. “Real Estate AFFO” and “AFFO”. However, because each REIT comes up with its own definition of “AFFO”, I labeled it as “WPC AFFO”.
In Q4 2022, WPC indicated all of WPC AFFO would be real estate AFFO. This is a change from prior years.
In 2022 WPC reported:
- Real Estate AFFO: $5.20
- WPC AFFO: $5.29
Therefore, there was still $.09 coming from investment management.
Why does that matter today? Because the “growth rate” depends on which starting value we choose.
Note: WPC tightened guidance in the Q2 2023 release. The midpoint is the same, but the low and high values each came in by $.02.
Same-Store Portfolio
Most equity REITs have same-store metrics. WPC has same-store values, but they don’t provide explicit same-store guidance consistently. The commentary they provided is included below for Q1 and Q2.
For Q1 2023:
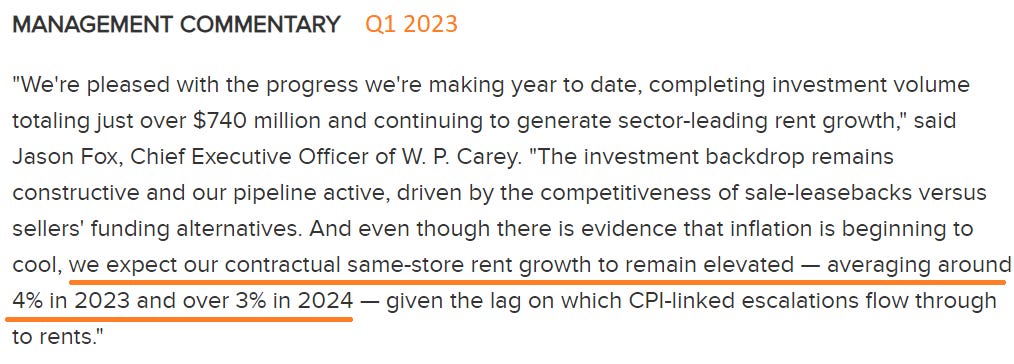
That’s as close as you’ll get to guidance on that metric.
For Q2 2023:
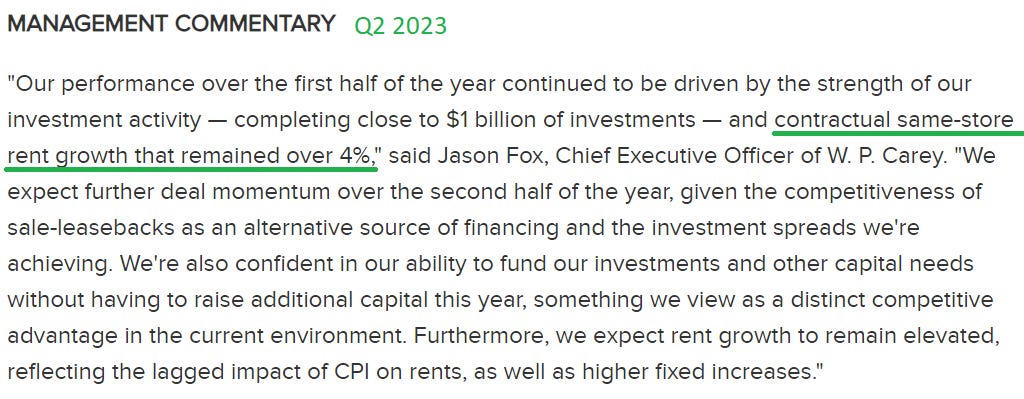
Since net lease REITs pass nearly all property expenses on to customers, same-property revenue and NOI should be very similar.
However, management didn’t reference same-property revenue. Jason Fox actually referenced “contractual same-store rent growth”. That might sound the same, but it is not. The earnings call provides more detail.
Earnings Call
The quote below demonstrates that same-store rent should be about 100 basis points below contractual same-store rent:
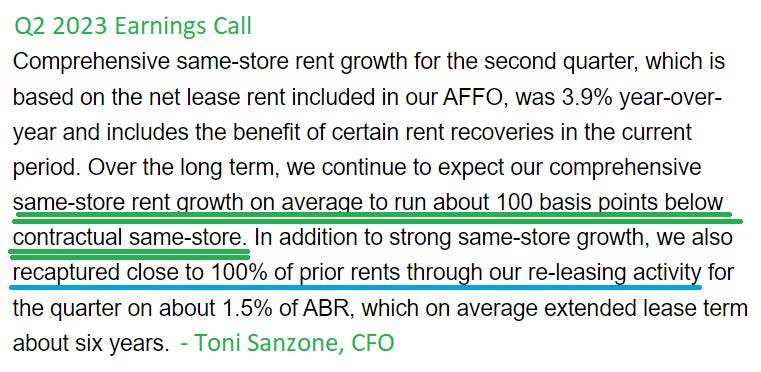
Using that comment from the Q2 2023 earnings call and Jason Fox’s comment in the Q1 2023 release, we can infer implied same-store rent growth guidance of 3% for 2023 and over 2% for 2022.
Contractual Same-Store Rent vs. Same-Store Rent
Why is contractual same-store rent growth different from same-store rent growth? Because contractual same-store rent growth references properties already under contract with no material change to the contracts. Net lease REITs don’t post impressive renewal spreads. As WPC stated, they recaptured close to 100% of prior rents. In other words, cash leasing spreads are roughly flat. We consider that normal for net lease REITs.
Quarterly Guidance
There is no quarterly guidance, so those tables aren’t useful here.
Guidance Changes and Growth Rates
The following charts demonstrate the changes in guidance (at the midpoint) by quarter and year-over-year growth rates using both Real Estate AFFO and WPC AFFO:
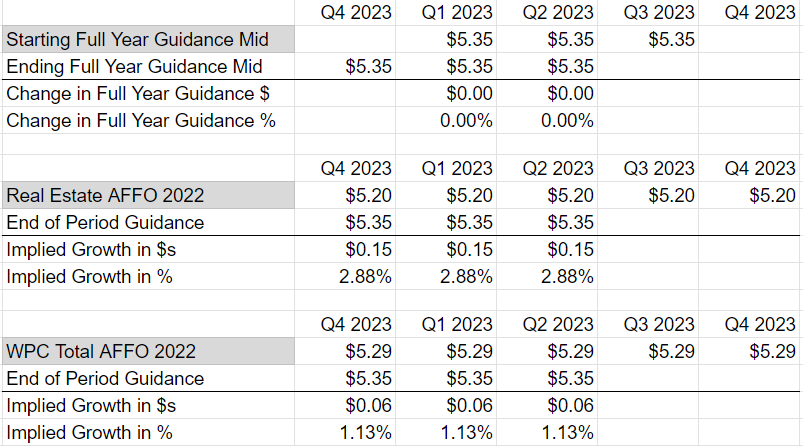
Normally those values would change more between quarters, but WPC’s midpoint has been $5.35 in the last 3 earnings release.
Strong Rent Growth, Weak AFFO Growth
Some investors will blame equity issuance. They are wrong. Acquisitions are attractive cap rates with higher escalators than the existing portfolio. Further, acquisitions are driving an adjustment in property type exposure.
The answer is floating-rate debt. Unfortunately, WPC also has quite a bit of near-term maturities. However, a material chunk of near-term maturities are floating-rate debt. We don’t want to count it twice. Floating-rate debts are already elevated, so expiring floating-rate debt is no worse than long-term floating-rate debt.
Because WPC is actively acquiring properties and pays out most of their cash flow, the total debt outstanding will trend higher (unless they issue equity just to pay down debt). Consequently, average interest rates across total debt will rise faster.
This is a headwind for all net lease REITs as it weakens the acquisition model. Partially due to this headwind, I expected net lease REIT prices to underperform other REIT types. Surprisingly, net lease REITs have been one of the stronger segments.
AFFO per share growth is only expected to be about 1.1% to 2.9%, depending on which AFFO value we use as the base for comparison. That’s despite the strong growth in same-property revenue. We should still see elevated rent growth through 2024, but debt maturities will be a headwind.
Acquisition
Net lease REITs are built for acquisitions. Acquisitions are a significant source of growth in AFFO. Despite issuing equity to fund acquisitions, it is still accretive to AFFO per share.
It’s no surprise WPC’s guidance includes far more acquisitions than dispositions. Guidance for both values has been unchanged throughout the year:
- Acquisitions midpoint: $2 billion
- Dispositions midpoint: $350 million
Property Type Changing
This is WPC’s real estate diversification as of Q2 2023:
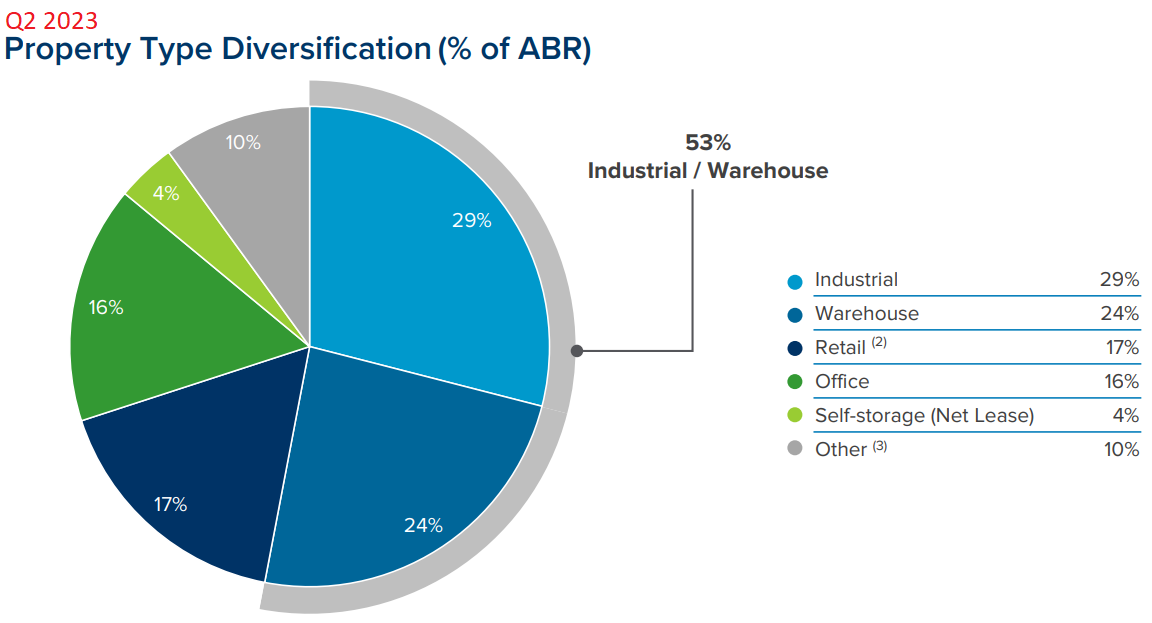
Office was down to 16%. That’s a big improvement from five years ago (Q2 2018):
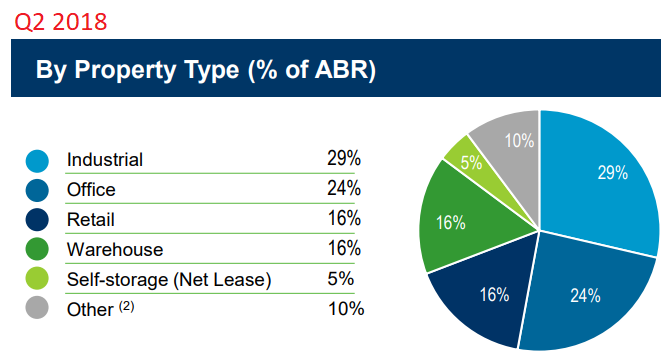
Office was the second largest exposure at 24%.
That implies a decrease of 800 basis points. Very good, though it’s less than management suggested during the call:
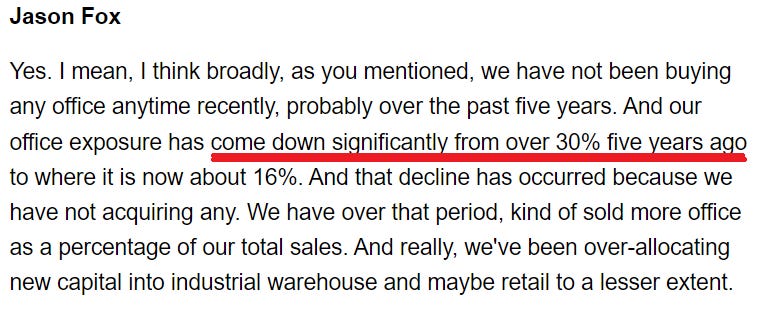
I checked other presentations around that time, not just the Q2 2018 presentation. Office was around 25% five years ago. To get a value of 30% or higher, I went back to Q4 2015.
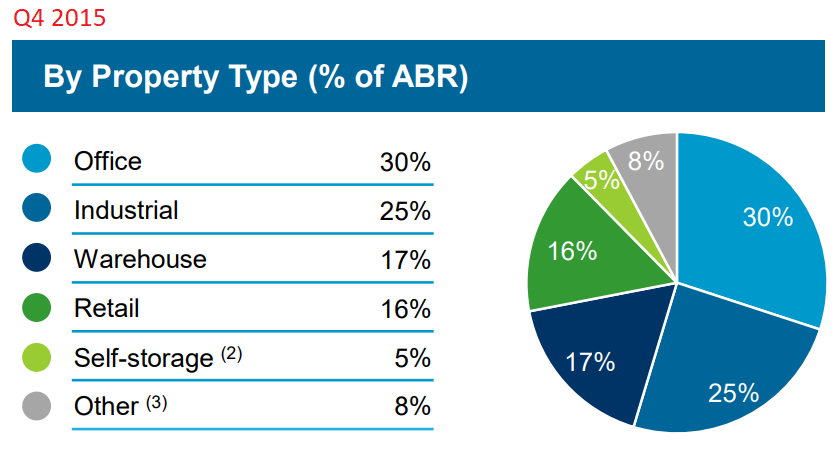
I think he just lost track of time a bit. That can happen easily. The point I want to make is that WPC has been improving the portfolio quality over that time. Issuing equity and buying new properties was a big factor in repositioning.
In my opinion, the new weights are much better. Cutting office from 30% to 16% is a huge achievement even if it took many years.
Buybacks / Stock Issued
Shares outstanding barely grew during the quarter. The change is literally a rounding error. Effectively it was about 0. It would’ve been a 1% increase in shares outstanding if it was 203 times larger. Rounding error.
WPC has been issuing equity using forward sale agreements. These can be very confusing for new investors. It’s a tool to lock in the share price. In many quarters WPC will settle part of their “Forward Equity” agreement and add new shares to the program.
For instance, in Q1 2023 WPC:
- Started with 6.524 million shares left to settle.
- Subtract 3.082 million settled shares.
- Add 1.302 million new shares locked in during Q1 2023
- End at 4.745 million shares left to settle.
In Q2 2023 the math is really simple.
- Start with 4.745 million shares left to settle.
- Subtract 0 settled shares.
- Add 0 new shares.
- End with 4.745 million shares left to settle.
As part of my due diligence, I checked the estimated price left on the remaining shares.
It should be slightly under $81 gross, which implies a net price closer to $80 (slight loss in transaction costs).
Expected net proceeds are about $384 million for 4.745 million shares.
Equity Issuance Challenge
After WPC uses the $384 million, they face a real problem. Shares are currently $64.51, well below the $80.93 I estimate as the locked-in price under the forward equity agreement.
- At $80.93, the AFFO yield is 6.61%
- At $64.51, the AFFO yield is 8.29%.
The average cap rate on acquisitions was 7.3%.
We can do some quick matha assuming WPC funds acquisitions with:
- 60% equity
- 40% debt at 5.2%
Note: 5.2% is 83 basis points over the 5-year Treasury and 98.5 basis points above the 10-year Treasury.
Calculate the weighted-average yield using AFFO for equity and interest for debt:
- At $80.93 per share, it would be 6.05%. Spread of 1.25%.
- At $64.51 per share, it would be 7.06%. Spread of 0.24%.
Assuming cap rates remain around 7.3%, the accretive impact would fall from about 125 basis points to about 24. That’s a huge difference. You want the benefits of a 125 basis point spread. At 24 basis points, it’s just not that much.
Debt
Variable (or floating) debt was about:
- 14.4% of WPC’s total debt as of 6/30/2023.
- 16.6% of WPC’s total debt as of 3/31/2023.
However, the total debt outstanding increased by about 4.26%.
The weighted-average interest rate also increased by 20 basis points:
- The weighted-average rate across all debt was 3.3% as of 6/30/2023
- The weighted-average rate across all debt was 3.1% as of 3/31/2023
Dividend
I’m not concerned about WPC’s ability to cover the dividend. However, I expect dividend growth rates to remain low for years. WPC has increased quarterly dividends each quarter by $.002 to $.003 per share. Tiny increases.
Why were increases so low previously? AFFO from investment management inflated the total AFFO (WPC AFFO) per share. I wrote some articles previously about WPC’s AFFO. The short version is that WPC finally generates all AFFO from real estate. Based on guidance, the current dividend payout ratio is about 80%. I would expect management to target a payout ratio between 70% and 80% of AFFO. They are at the upper end of that range today, but I believe they will be committed to dividend growth (which is smart).
To get down to a 75% payout ratio, the dividend growth rate needs to be less than the AFFO growth rate.
Higher rates on debt are absorbing a large portion of the benefit from faster revenue growth. Consequently, AFFO growth remains pretty low. Therefore, it could take a few years for AFFO to get a big enough headstart on dividends.
There are two factors I see that would drive a material increase in AFFO per share:
- If WPC could continue issuing equity at around $80 per share, that would enable more accretion from acquisitions.
- If real rates go negative again. WPC would benefit from lower rates while still achieving elevated rent growth.
WPC had negative real rates in place previously and grew Real Estate AFFO very effectively. However, WPC AFFO was less impressive as investment management AFFO dropped to $0. Consequently, some investors may underestimate how effectively WPC improved during the last several years. The quality of AFFO improved significantly as it now comes entirely from real estate and the real estate portfolio quality improved.
Note: Inflation improves rent growth. Low rates reduce interest expenses. If we have negative real rates, then rent should outpace interest expense.
Conclusion
No change to guidance. Given the rise in interest rates and WPC’s floating rate exposure, we could treat that as a slight positive. Floating rate exposure has been a material factor for Q2 2023 guidance updates across equity REITs.
Rating for the release? Probably a 6 or a 6.5. Definitely better than a 5. As I go through the other net lease REITs, it should be easier to lock it in. In preparing this, I did a quick check on the peers. However, I haven’t dug into them the way I did on WPC.
Net lease REITs benefit from a significant increase in same-property revenue growth rates due to inflation escalators. New fixed-rate leases also include higher annual bumps than leases written several years ago. As cap rates on acquisitions increase, net lease REITs can still generate some incremental growth in AFFO per share by issuing equity for acquisitions. Due to the higher cost of new debt, the accretive impact is lower.
Net lease REITs need to combine accretive acquisitions with the benefits of faster same-property revenue growth to mitigate the impact of higher interest rates. Some investors may incorrectly blame the equity issuance for slower growth in AFFO per share. The real issue is interest rates. Lower prices may also create a drag on acquisition opportunities.
Net lease REITs tend to use a significant amount of debt because their model provides greater certainty about future cash flows. That certainty helped to mitigate the risk of using more debt. In prior periods, using more debt was also very accretive for acquisitions. At today’s rates, using debt for acquisitions is only slightly accretive.
I expect slow but steady dividend growth to continue over the next few years. If real rates remained negative, I think AFFO per share growth would’ve run much higher and fueled faster dividend growth. Outside of major black swan events, I would expect dividend growth to accelerate after a few years.
I currently have no position in WPC or any of the other net lease REITs. I’m not expecting to change that in the near future. Shares have a larger discount than other net lease REIT peers, but the sector headwinds to AFFO per share growth remain. The inflation advantage for near-term revenue growth (inflation escalators built into some leases) is nice, but the interest expense challenge offsets it.
Member discussion