

Weekly Series: mREIT And BDC Recommendations (And Price Targets) As Of 08/06/2023
Weekly Series: mREIT And BDC Recommendations (And Price Targets) As Of 08/06/2023

Hi subscribers.
Within the “New Commentary and Images” section, you’ll find brief summaries of what happened for fundamentals over the last week. Then you’ll find charts and tables covering all the major developments.
This article is a joint effort between CWMF and Scott Kennedy.
Who Does What?
Scott provides full coverage for:
20 Mortgage REIT common stocks
15 BDC common stocks
For each stock that includes:
Research and data
Modeling projected book values / net asset values (BV/NAV)
Setting common stock recommendation ranges (targets / ratings)
Answering a few questions on the stocks
Colorado (“CO” / “CWMF”) Wealth Management Fund provides coverage on:
Equity REIT common stocks
Mortgage REIT preferred stocks
Introductory articles for relevant concepts
Macroeconomic trends
Layout
The rest of this article is split into two major categories:
New commentary & images for this week. (Pretty fast)
Repeated sections (linked for the moment, as we revise the method for including them).
You’ll know you’ve hit the repeated section. It has a pretty obvious image. With that said. Let’s get into the article.
New Commentary and Images Begin
A Few Notes from Scott:
Positions: Added to my MITT-C position this week (nearly doubled my position).
BDC Weekly Change: NAVs relatively unchanged - slightly decreased. Spreads were relatively unchanged - slightly widened.
Other Comments: Continuing the June - July 2023 trend, market remains “cautiously optimistic” on high yield debt/speculative-grade credit. Spreads remain resilient as the market continues to “grapple” between plateauing short-term interest rates and economic uncertainty (typically impacting the longer-end of the yield curve).
Underlying Portfolio Company Credit Changes Held by BDCs (Weekly): 1 downgrade (ARCC + OCSL + GBDC + SLRC; same portfolio company).
Underlying Portfolio Company Credit Changes Held by BDCs (Current Quarter-to-Date):
This is a running tally of the credit upgrades and downgrades for companies held by each BDC.
ARCC: 2 Down
OCSL: 1 Down
FSK: 1 Up, 1 Down
MAIN: 1 Up
PSEC: 3 Up (Includes 1 Restructuring), (1) Down
GBDC: 1 Down
SLRC: 1 Down
TCPC: 1 Up
OBDC: 1 Up
TPVG: 1 Declared Bankruptcy
Underlying Portfolio Company Credit Changes Held by BDCs (Prior Quarter):
This is a running tally of the credit upgrades and downgrades for companies held by each BDC.
ARCC: 2 Up (1 Solely Unfunded Commitment), (2) Down
CSWC: 1 Up, (1) Down
FSK: (2) Down (1 Portfolio Company Double Downgrade + Declared Bankruptcy)
MAIN 1 Up, (1) Down
OCSL: (1) Down
OBDC: (4) Down, 1 Up
SLRC: (1) Down
PFLT: (1) Down
PSEC: (4) Down (Already Anticipated Hence Our Prior Recommendation Range and Risk Rating Downgrade Back in May; Prior To The Actual Credit Downgrades)
TCPC: (1) Down
TPVG: 3 Declared Bankruptcies
View: Same as last week. - Still expect an eventual mild recession to pressure NAVs late 2023 - early 2024. Factored into price-to-book targets. Spreads will likely widen beginning in late summer - fall 2023. Still tight relative to history.
MREIT Weekly Change: All BVs decreased (outside any applicable earnings-related true up (down) CURRENT BV adjustments). Unlike the prior week, a volatile week for BVs as a whole. Agency mREITs who had lower-coupon agency MBS and derivative instruments with a shorter tenor-maturity were most negatively impacted.
Other comments: With their higher durations, agency mREITs, as a whole, experienced the largest weekly BV decreases (percentage-wise). Agency MBS pricing experienced a minor - modest decrease (more severe within lower coupons). Derivative instruments towards the shorter-end of the yield curve actually decreased while hedges towards the longer-end of the yield curve only slightly increased. Simply put, the vast majority of spread relationships (I/we track over 100+ combinations) modestly - notably widened. This was very likely the direct result of the US credit downgrade (short-term event). Most hybrid, originator + servicer mREITs experienced minor BV decreases. Repo financing continued to creep higher during the week (as anticipated with the 25 basis point (“bp”) Fed Funds Rate hike on 7/26/2023). That said, the rate of financing cost acceleration has slowed over recent weeks (which was already anticipated).
View: Same as last week. Most agency mREITs likely remain in common share issuance mode (rebuild capital as MBS pricing remains historically attractive). MSR valuations have likely recently peaked but remain elevated versus historical trends. I/We do not anticipate a notable drop in MSR valuations over the foreseeable future (especially on lower coupons). Repo financing rates should peak in late 2023. Agency net interest spreads (excluding current period hedging income) are slightly - modestly negative. However, dependent on the utilization of interest rate payer swaps, adjusted net interest spreads remain attractive/acceptable for most peers (though will continue to slightly - modestly decrease over the next several quarters). Repo financing will continue to move a bit higher during 2023. Net interest spreads will continue moving lower during the second half of 2023 and will likely “bottom out” towards year-end. Then, a slow, gradual increase will likely begin in early 2024. There will continue to be pressure in commercial whole loan pricing/valuations, especially in office loans. Simply put, continued credit/recession risk. However, there continues to be a bright spot for industrial loans (especially with the notion of a possible “soft landing” for the economy as a whole). Could even throw hospitality and retail loans in that mix (certainly better than the COVID-19 trends) but isolated credit events will occur in these sub-sector as well. As previously noted, with continued pricing pressure on office valuations, I/we made the prudent decision to slightly lower the commercial whole loan mREIT’s percentage recommendation ranges heading into Q3 2023. This included updated modeling of all 3 sub-sector peer’s peak non-accrual rate this credit cycle towards the high end of my/our previous range. This negatively impacted per share recommendation ranges a bit in late June 2023. ACRE, BXMT, and GPMT will continue to have heightened monitoring regarding asset/loan resolution within the office sub-sector and all other troubled loans. As the risk ratings indicate, BXMT should come out of this credit cycle the least harmed out of the 3 covered sub-sector peers. This notion was only solidified after fully analyzing BXMT’s Q2 2023 earnings results in late July 2023. This should be followed by ACRE and then GPMT. At GPMT’s level of discount to estimated CURRENT BV, subscribers should be eyeing/hoping for an eventual acquisition/merger by a 3rd party. Similar to AAIC, this will likely take some time (especially for this specific sub-sector) so subscribers have to be patient with GPMT’s prospects. As a reminder for subscribers, each company's earnings assessment article (linked in the tables deeper in this article) takes a deeper dive into a company's investments/sub-portfolio trends. That is where the details for each covered peer are provided.
A Few Notes from CWMF:
Positions: No change.
Commentary:
I’ll use my section this week to post a few charts to demonstrate Scott’s comments about mortgage REIT BVs going down.
Asset values went down:
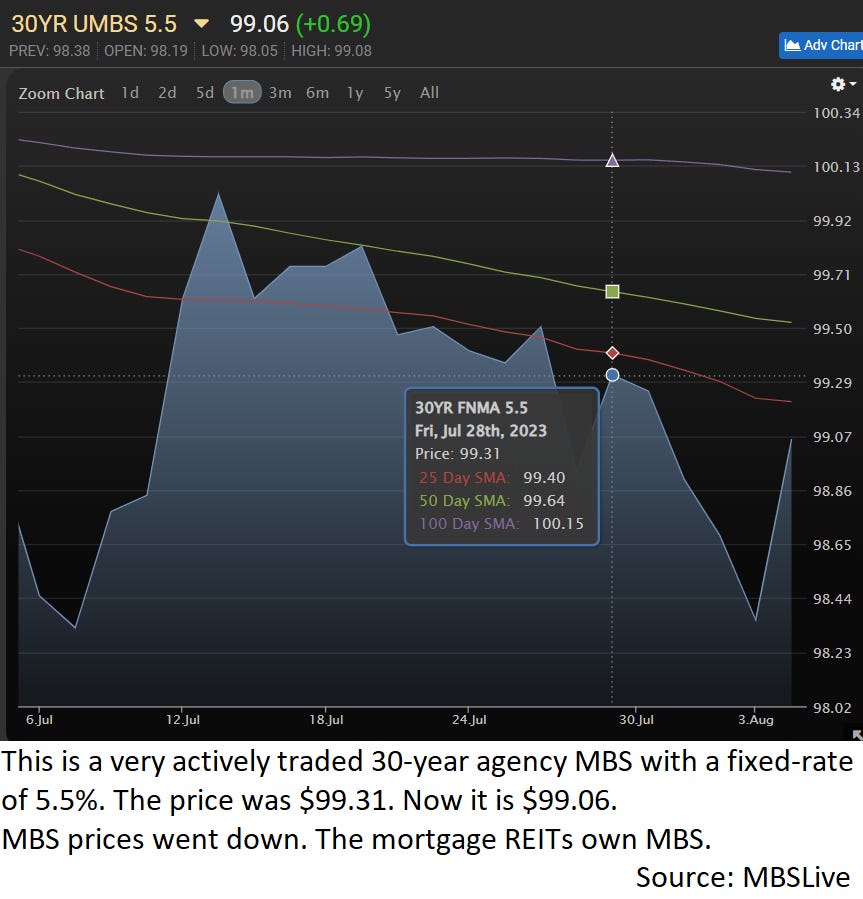
Lower values for assets reduces book value. However, it could be offset by gains on hedges. Not this week though. This week hedges also lost value.
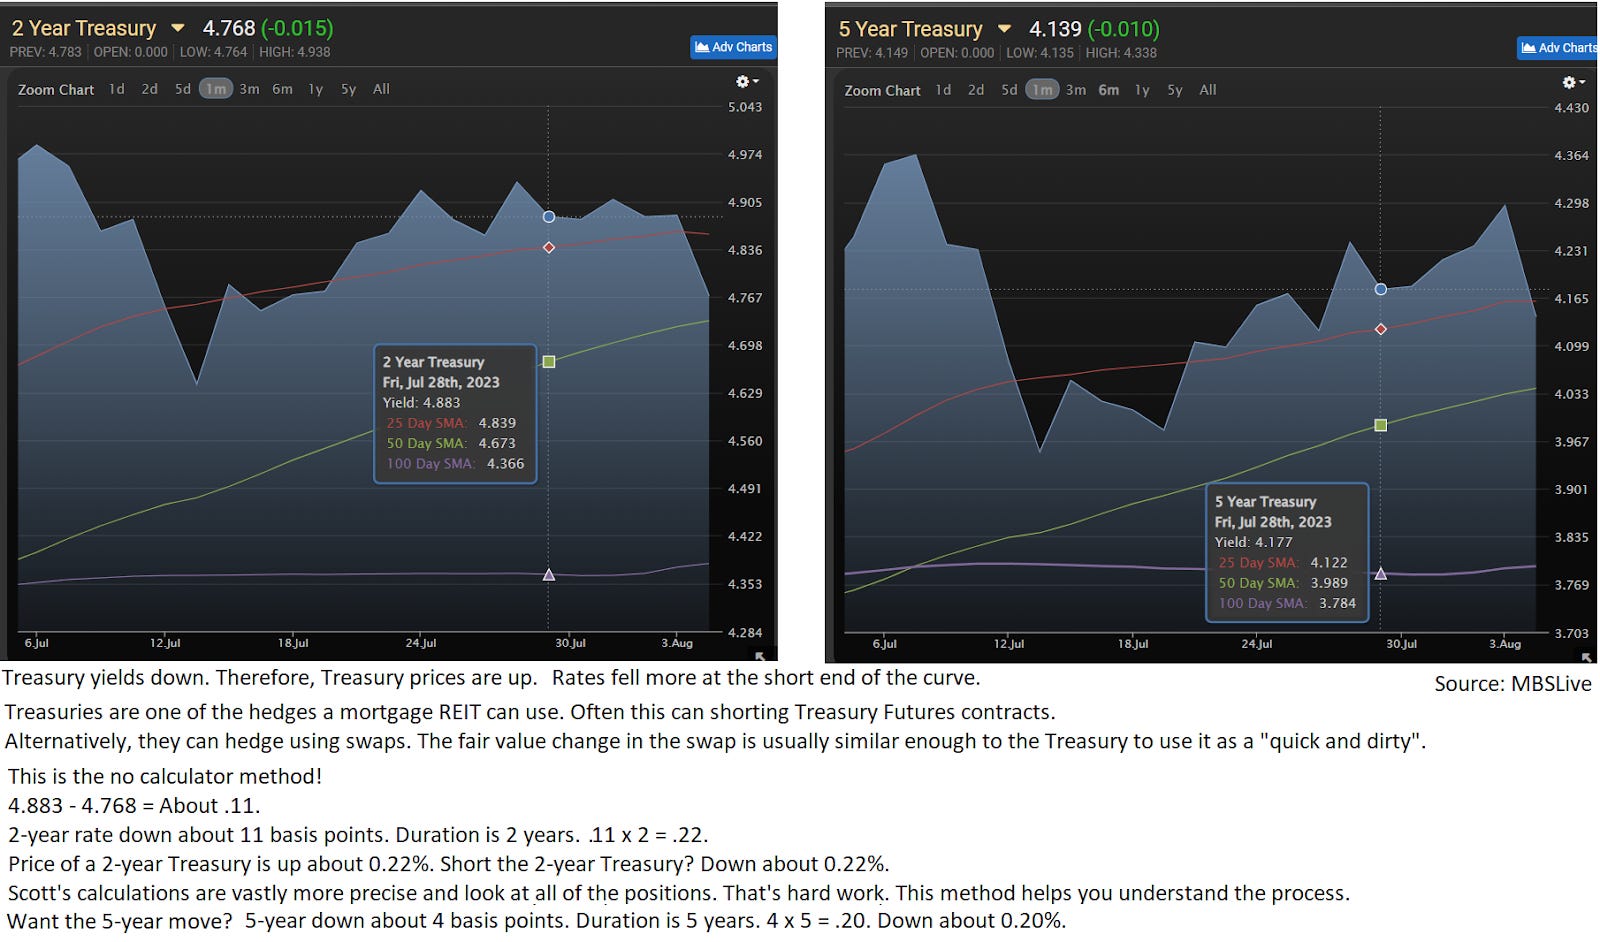
With those charts I can approximate assets down .25% and hedges down .22%. Let’s assume hedges and assets both have a value that is 7 times equity (as a rough example). Let’s assume 7x equity for both assets and hedges. We’ve got about -1.75% from assets and -1.55% from hedges. Since we have losses on both sides, that combines to -3.3%.
Is that remotely close to the average BV change for the agency mortgage REITs? Pretty close. The average was -2.3%, but that includes an outlier from Two Harbors. TWO reported a positive surprise on BV of 3.7%. There are 8 agency mortgage REITs in the group, so a 3.7% boost for TWO is boosting the average by nearly 0.5%. Strip that out, and the average would be about -2.8%. That’s pretty close to my -3.3% value.
So why model each REIT separately?
The difference in projected changes ranges from 3.2% (with the 3.7% positive surprise) to negative 4.5%. While my quick and dirty method got us close to the average for the sector, it did nothing to tell investors which REITs were positioned better or worse. That’s why Scott’s doing the harder math to create more precise estimates.