Scott Kennedy’s mREIT Earnings Series: Assessing PennyMac Mortgage’s And ARMOUR Residential’s Performance For Q1 2024
Scott Kennedy’s mREIT Earnings Series: Assessing PennyMac Mortgage’s And ARMOUR Residential’s Performance For Q1 2024

Summary
This earnings assessment article reviews PMT’s and ARR’s BV and net interest spread/core earnings/EAD performance during Q1 2024 and compares results to expectations. Earnings remain a driver to stock performance.
PMT’s BV matched my/our expectations (well within range) while its net interest spread was a minor underperformance. This mainly related to a larger-than-anticipated decrease in PMT’s agency MBS sub-portfolio size.
However, PMT’s forward adjusted diluted EPS guidance was raised which is positive. No change in PMT’s percentage recommendation ranges or risk/performance rating. PMT is currently deemed very slightly undervalued (BUY).
ARR’s BV modestly-notably outperformed my/our expectations (OUTSIDE range) but this was solely due to a very poor management BV estimate provided to the public in early March 2024.
ARR’s adjusted core earnings/EAD was nearly an exact match. No change in ARR’s percentage recommendation ranges or risk/performance rating. ARR is currently deemed appropriately valued (HOLD).
Formatting Change to this Article Series
We have recently changed the format of this earnings-related article series (less wording, more visual images). This process remains ongoing and future changes will likely occur.
1) PMT:
Commentary
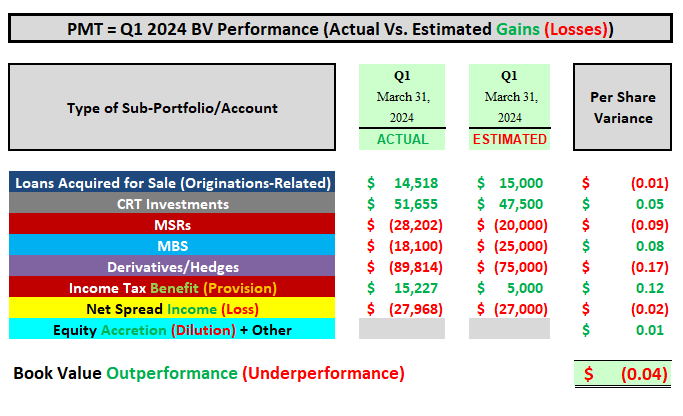
Quarterly BV Fluctuation: Basically an Exact Match (0.2% Variance).
Net Interest Spread: Minor Underperformance (($0.02) Variance).
An “as expected” quarter on BV for PennyMac Mortgage Trust PMT 0.00%↑ in my opinion. PMT recorded a fractional BV decrease versus my comparison of a fractional increase. This is a pretty hard feat to accomplish when considering all the moving parts within PMT’s business model (numerous sub-portfolios), along with continued notable sector volatility regarding asset pricing and all the types of derivative instruments management utilizes at any given point in time. Let us briefly discuss how PMT’s segments/sub-portfolios performed when compared to my expectations.
First, PMT experienced a notable decrease in correspondent loan acquisitions/volume within the company’s origination/production platform during Q1 2024 when compared to Q4 2023. PMT had conventional correspondent loan acquisitions of $18.1 billion during Q1 2024 which was a quarterly decrease of (23%). This largely matched my expectations of a quarterly (20%) decrease. This was due to PMT focusing on originating profitable loans while also factoring in seasonality. This resulted in a largely as expected net valuation gain on loans acquired for sale within the company’s correspondent loans sub-portfolio (including a very similar GOS margin). Second, PMT experienced a slightly more enhanced valuation fluctuation within the company’s CRT sub-portfolio when compared to my expectations. CRT investments, as a whole, continued to experience spread tightening during Q1 2024. Credit risk within PMT’s various CRT vehicles has remained very subdued which remains a positive catalyst/trend (but this was already previously anticipated).
Third, the valuation fluctuations within PMT’s MSR sub-portfolio were largely as expected during Q1 2024. If anything, a very minor underperformance. When broken out, this included MSR amortization of ($100) million and “pure” valuation changes of $72 million (based on longer-term prepayment and default expectations). In comparison, I projected MSR amortization of ($95) million and “pure” valuation changes of $75 million. PMT’s MSR sub-portfolio experienced a quarterly increase in valuation multiple from 6.01x during Q4 2023 to 6.05x during Q1 2024. In comparison, I projected a valuation multiple of 6.10x during Q1 2024.
Fourth, PMT’s MBS sub-portfolio (mainly agency) slightly outperformed my expectations from a BV perspective. This was mainly due to PMT modestly decreasing the company’s fixed-rate agency MBS sub-portfolio during the quarter. A smaller portfolio size directly led to less severe valuation losses as pricing decreased during the quarter. Fifth, PMT’s hedging/derivative instruments sub-portfolio slightly – modestly underperformed my expectations from a BV perspective. As pointed out in the past, management utilizes 10 - 15 different types of hedges during any given quarter (very complex versus most peers). In addition, unlike most sector peers, PMT constantly switches between net long (short) positions during the quarter in some instruments as management sees fit regarding interest rate risk strategies. Simply put, sometimes it is hard to “pinpoint” exact strategies during any given quarter. Finally, PMT’s income tax (provision)/benefit account slightly exceeded my expectations. This can be one of those “quirky” accounts from quarter-to-quarter but no notable issues this quarter.
Moving on, unfortunately, PMT is one of the rare mREIT peers that does not provide an “official” core earnings/EAD metric. As such, I cannot provide commentary on that specific metric. When strictly reviewing net interest spreads (which excludes unrealized and realized valuation gains/losses), PMT reported a modest decrease in interest income which was only partially offset by a minor decrease in interest expense. PMT’s net interest spread was a ($0.02) per common share underperformance when compared to my expectations. This was mainly due to the aforementioned modest decrease in PMT’s agency MBS sub-portfolio during the quarter.
A risk/performance rating of 3.5 for PMT remains appropriate in the current environment/over the foreseeable future as this mREIT can better combat (via the company’s MSR sub-portfolio) the “higher-for-longer” rates/yields scenario.
BV Performance (Actual Vs. Estímated)