

Scott Kennedy’s mREIT Earnings Series: Assessing Chimera Investment’s And Franklin BSP Realty Trust’s Performance For Q4 2023
Scott Kennedy’s mREIT Earnings Series: Assessing Chimera Investment’s And Franklin BSP Realty Trust’s Performance For Q4 2023

Introduction section by Colorado Wealth Management Fund.
Article section by Scott Kennedy.
Bringing More of Scott’s Work to Our Website
The REIT Forum is a service produced by Michael Vanloon (better known as Colorado Wealth Management Fund) and Scott Kennedy. After intense consideration, I decided to launch our service through Substack. Since then, we’ve seen great success. Substack enables us to give readers real-time alerts with entire articles delivered directly to their inboxes.
You’re probably used to seeing the “from” field saying: “ColoradoWealthManagementFund from The REIT Forum”.
In some of our future e-mails, it may say:
“Scott Kennedy from The REIT Forum”.
That will simply mean we’ve updated the backend of the website for Scott Kennedy to directly post his articles.
I want to make browsing our work as simple as possible for readers. This will be another step in that direction.
For the moment, I’ll be posting Scott’s work. The following articles are a direct copy and paste from Scott. While we get the back end set up, there is a delay in getting the articles posted. Rest assured that it should be solved soon.
Finding Our Positions
I posted a subscriber-exclusive article with links to our Google Sheets. You can always access our positions there. Scott’s positions are updated each week. CWMF’s positions are usually updated on the same day as the trade.
Disclosures
Related to the stocks in this article:
CWMF is long: RITM-D, GPMT-A, DX-C, EFC-A, RITM-C, EFC-B, PMT-C, AGNCP, CIM-D, RITM-B, RITM, SLRC, GPMT, RC.
Scott Kennedy is long: RITM, RC, SLRC, GPMT, ARCC, GBDC, RITM-D, MITT-B, MITT-C, GAINL, ECCC.
The rest of this post is from Scott Kennedy.
Summary
This 13th earnings assessment article reviews CIM’s and FBRT’s BV and core earnings performance during Q4 2023.
CIM’s BV was a modest underperformance while its core earnings matched my/our expectations. FBRT’s BV matched my/our expectations while its core earnings was a minor underperformance.
No change in CIM’s percentage recommendation ranges or risk/performance rating. CIM is currently deemed notably undervalued (STRONG BUY). CIM remains a speculative play (high-very high risk).
FBRT received a 2.5% recommendation range “downgrade”. This resulted in a risk/performance rating downgrade to 4. The addition of 4 "watch list" loans is a bit troubling/cause for concern.
That said, FBRT still has a bit of value (hence deemed undervalued (BUY)). Cautious subscribers may want to wait until market sentiment around commercial R/E improves (remain/can be patient).
Introduction:
Hi subscribers. For new members, my name is Scott Kennedy and currently I fully cover 20 mortgage real estate investment trust (mREIT) and 15 business development company (“BDC”) common stocks within this Investing Group regarding research/data, subscriber questions, weekly projected book values/net asset values (BV/NAV), and common stock recommendation ranges. Colorado (“CO”) Wealth Management handles the mREIT preferred stocks and he and his team handles all other applicable REIT sectors outside the mREIT sector. CO also provides some mREIT common stock and BDC articles from time-to-time which are more of an “overview/introduction” discussion; typically based either on my or our combined research/data. This also includes some macroeconomic trends and data. My name is always attached to all Investing Group articles I personally wrote so there is no confusion for subscribers.
This REIT Forum article is part of a series of articles over a span of 6-7 weeks which will analyze my previously projected BV/NAV and core earnings (or core earnings equivalent)/net investment income (“NII”) figures and compare these metrics to each mREIT’s and BDC’s actual reported results, respectively. For readers who are familiar with my public mREIT and/or BDC articles, these types of articles are beneficial to readers who desire to pursue a more active investing strategy and/or want more “real time” thoughts/analysis.
I hope my services/contributions ultimately help enhance a subscriber’s total investment returns or minimize their total investment losses within the mREIT and BDC sectors. At the very least, I hope subscribers will gain more insight into the mREIT and BDC sectors by reading my/our exclusive REIT Forum articles.
1) CIM’s BV and Core Earnings Q4 2023 Performance (Projected Versus Actual Results):
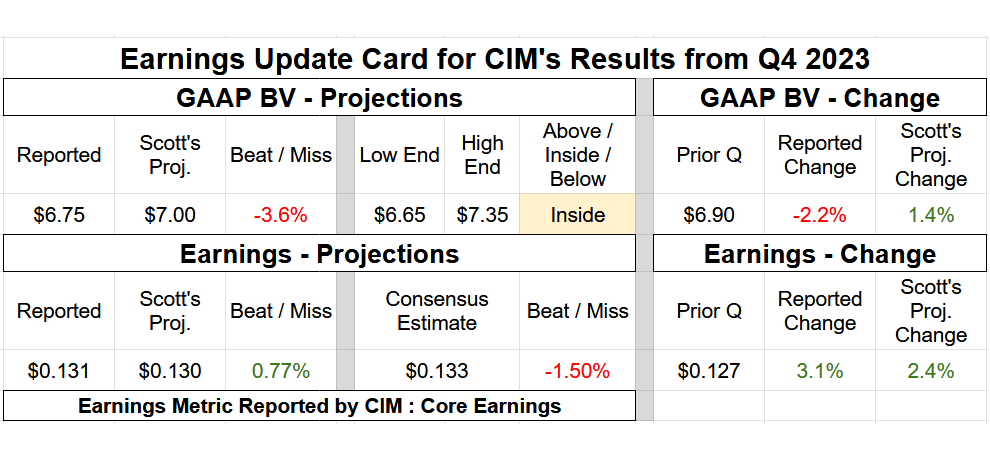
On 2/14/2024, Chimera Investment Corp. CIM 0.00%↑ reported the company’s earnings results for the fourth quarter of 2023. Table 1 below provides CIM’s BV and earnings summary.
Table 1 – CIM Q4 2023 BV and Earnings Summary
Source: Taken Directly from the REIT Forum’s © Analytical Spreadsheets/Data
I provided the following commentary in regards to CIM’s results for the fourth quarter of 2023:
“Hi subscribers. I was able to review CIM's Q4 2023 earnings results in more depth. CIM reported a BV as of 12/31/2023 of $6.75 per common share (2.2% decrease) versus my prior projection of $7.00 per common share (1.4% increase). I consider this a modest (at or greater than a 2.5% but less than a 5.0%) underperformance and was within my $6.65 - $7.35 per common share range (towards the low end). Let us reconcile CIM’s quarterly BV fluctuation when compared to my expectations.
First, when reviewing CIM’s investment portfolio, for the second consecutive quarter, management was pretty “dormant” across all sub-portfolios during the fourth quarter of 2023. CIM basically continued to “roll-off”/call some agency commercial mortgage-backed securities (“CMBS”) during the quarter. CIM also rolled-off the company’s agency interest-only (“IO”) and non-agency residential MBS (“RMBS”) during the fourth quarter of 2023. In addition, CIM continued to take “the foot off the accelerator” regarding the company’s residential whole loans sub-portfolio. In particular, CIM reduced the company’s residential whole loans by less than ($0.1) billion during the fourth quarter of 2023 (which also factors in valuation increases). In comparison, I projected an increase of $0.1 billion. In addition, CIM sold some of these investments during the quarter when pricing was not ideal which resulted in some realized losses/underperformance when compared to my BV projection. In addition, CIM has recently continued to refinance some legacy debt securitizations (liabilities) via creating new collateralized debt/loan obligations (CDO/CLO). All debt securitizations are non-recourse in nature and have no “mark-to-market” call provisions.
Regarding valuation fluctuations within CIM’s entire investment portfolio, the company recorded a total investment portfolio net realized loss and unrealized valuation gain of $8 million during the fourth quarter of 2023 (the majority of this gain was within residential whole loans [netted against securitized debt]). In comparison, I projected CIM’s entire investment portfolio (including agency and non-agency RMBS/CMBS valuation fluctuations) would have a net valuation gain of $35 million. I was a bit disappointed CIM did not purchase any fixed-rate agency RMBS during the quarter at or near intra-quarter lows. This would have directly resulted in a nice, quick valuation gain for the quarter (especially since management raised capital). When calculated, this ($27) million variance directly led to a BV underperformance of ($0.12) per common share when compared to my expectations.
Second, I correctly projected CIM would basically maintain the company’s derivative instruments/hedges during the fourth quarter of 2023 (aside from maturing contracts). As I have noted in previous earnings notes, derivative instruments/hedges are not solely meant/used for agency mortgage-related investments. This is something CIM “learnt the hard way” during 2022 which was at least partially linked to the prior termination of a C-suite executive (lack of derivative instruments heading into 2022). CIM was simply “too late to the party” regarding properly managing interest rate risk during 2022. CIM reported a derivatives net valuation loss (excluding current period hedging income which is a part of core earnings/earnings available for distribution (“EAD”)) of ($16) million during the fourth quarter of 2023. In comparison, I projected a derivatives net valuation loss of ($13) million. When calculated, this ($3) million variance directly led to a BV underperformance of only ($0.01) per common share when compared to my expectations.
When both variances noted above are combined, along with a debt extinguishment underperformance of ($0.03) per common share, equity dilution of ($0.09) per common share from the issuance of 14.6 million shares of common stock at a notable discount to BV (which I did not like), and a core earnings/EAD outperformance of $0.001 per common share (which will be discussed next), this fully reconciles to CIM’s BV underperformance of ($0.25) per common share when compared to my expectations.
Moving on, CIM reported core earnings/EAD of $0.131 per common share for the fourth quarter of 2023. In comparison, I projected CIM would report core earnings/EAD of $0.130 per common share. CIM’s core earnings/EAD was $0.127 per common share for the third quarter of 2023. As such, I projected a core earnings/EAD increase of $0.003 per common share. In actuality, CIM reported a core earnings/EAD increase of $0.004 per common share. The institutional analysts’ consensus average was core earnings/EAD of $0.133 per common share. Even though this was basically an exact match, let us provide a detailed reconciliation for discussion purposes.
First, I would point out this figure includes all discount accretion/prepayment fees that are “trued-up” when a non-agency RMBS/agency CMBS is called by CIM. This is analogous to a business development company’s (“BDC”) original issue discount (“OID”) true-up and/or prepayment fees when a loan is prepaid. Simply put, once a particular loan/securitization is called, all unaccounted-for discount accretion and/or prepayment fees have to be accounted for in the period of occurrence. As such, it accelerates GAAP income/core earnings/EAD. CIM reported $12.8 million of discount accretion/prepayment fees during the fourth quarter of 2023. In comparison, I projected CIM would report $12.5 million of discount accretion/prepayment fees during the quarter. When calculated, this $0.3 million variance directly led to a core earnings/EAD outperformance of $0.001 per common share when compared to my expectations. As such, a very accurate projection again this quarter. I correctly anticipated an “uptick” in this figure mainly due to the quick decline in mortgage interest rates/U.S. Treasury yields.
Second, with CIM’s recent continued efforts to “shore up” the liability side of the balance sheet, via continuing to “replace/transfer” some recourse debt to non-recourse debt through loan securitizations, this did result in higher interest expense during the third quarter of 2023. However, I was pleased overall borrowing costs stabilized during the fourth quarter of 2023. This was a step in the right direction and matched expectations (in part due to LIBOR/SOFR/PRIME plateauing). CIM reported quarterly net interest income of $63.4 and $64.7 million during the third and fourth quarter of 2023, respectively. In comparison, I projected net interest income of $65.0 million during the fourth quarter of 2023. When calculated, this ($0.3) million variance directly led to a core earnings/EAD underperformance of ($0.002) per common share when compared to my expectations.
Third, CIM reported slightly lower operational expenses during the fourth quarter of 2023 when compared to my expectations. This was mainly within CIM’s compensation and benefits expenses. As a general reminder, transaction expenses (mainly due to securitization activity) is already reversed out of core earnings/EAD. CIM reported total operational expenses of $20.8 million during the fourth quarter of 2023. In comparison, I projected total operational expenses of $21.0 million. When calculated, this $0.2 million variance directly led to a core earnings/EAD outperformance of $0.002 per common share when compared to my expectations.
When the 3 variances noted above are combined, this fully reconciles back to CIM’s core earnings/EAD outperformance of $0.001 per common share when compared to my expectations for the fourth quarter of 2023.
So, all-in-all, a modest underperformance on CIM’s BV (variance of 3.6%) and basically an exact match on the company’s core earnings/EAD (variance of only $0.001 per common share). So, a couple minor “blunders” per se on the BV side of the equation (some dilutive equity, no agency MBS purchases, and mistimed asset sales) but CIM reported stable core earnings/EAD.
When taking CIM’s recent and projected performance into consideration, along with macroeconomic trends/events (mainly Fed monetary policy, the general projected movement of rates/yields, and projected economic performance over the foreseeable future), no change to my/our CIM percentage recommendation ranges (relative to CURRENT BV) or risk rating (remains at a 4.5). Remember, I/we downgraded CIM (6.5%) last quarter on very poor operational performance and the notable dividend reduction (51% cumulative decrease within just 1 year). CIM’s performance during the fourth quarter of 2023 (and projected performance over the foreseeable future) does not warrant any further downgrade (or upgrade) at this point in time.
At a closing price as of 2/15/2024 of $4.44 per share, CIM is deemed to be NOTABLY UNDERVALUED/a STRONG BUY recommendation (price target of $5.85 per share). Currently, CIM has some good – very good value (close to UNDERVALUED). However, I/we continue to believe an investment in CIM’s common stock is a “speculative” play. Simply put, high - very high risk but the potential for higher rewards, via stock price appreciation OVER TIME, is a possibility. Again, CIM has a risk rating of 4.5. Simply put, not a great “fit” for your very cautious - cautious investor. CIM should probably ONLY be considered a short-term “swing”/speculative trade based on value at this point…”