

Scott Kennedy’s mREIT And BDC Earnings Series: Assessing New York Mortgage Trust’s And Blue Owl Capital’s Performance For Q4 2023
Scott Kennedy’s mREIT And BDC Earnings Series: Assessing New York Mortgage Trust’s And Blue Owl Capital’s Performance For Q4 2023

Introduction section by Colorado Wealth Management Fund.
Article section by Scott Kennedy.
Bringing More of Scott’s Work to Our Website
The REIT Forum is a service produced by Michael Vanloon (better known as Colorado Wealth Management Fund) and Scott Kennedy. After intense consideration, I decided to launch our service through Substack. Since then, we’ve seen great success. Substack enables us to give readers real-time alerts with entire articles delivered directly to their inboxes.
You’re probably used to seeing the “from” field saying: “ColoradoWealthManagementFund from The REIT Forum”.
In some of our future e-mails, it may say:
“Scott Kennedy from The REIT Forum”.
That will simply mean we’ve updated the backend of the website for Scott Kennedy to directly post his articles.
I want to make browsing our work as simple as possible for readers. This will be another step in that direction.
For the moment, I’ll be posting Scott’s work. The following articles are a direct copy and paste from Scott. While we get the back end set up, there is a delay in getting the articles posted. Rest assured that it should be solved soon.
Finding Our Positions
I posted a subscriber-exclusive article with links to our Google Sheets. You can always access our positions there. Scott’s positions are updated each week. CWMF’s positions are usually updated on the same day as the trade.
Disclosures
Related to the stocks in this article:
CWMF is long: RITM-D, GPMT-A, DX-C, EFC-A, RITM-C, EFC-B, PMT-C, AGNCP, CIM-D, RITM-B, RITM, SLRC, GPMT, RC.
Scott Kennedy is long: RITM, RC, SLRC, GPMT, ARCC, GBDC, RITM-D, MITT-B, MITT-C, GAINL, ECCC.
The rest of this post is from Scott Kennedy.
Summary
This 16th earnings assessment article reviews NYMT’s and OBDC’s BV/NAV and core earnings equivalent/NII performance during Q4 2023.
NYMT’s BV was a minor-modest outperformance while the company’s portfolio yield matched my/our expectations. OBDC’s NAV was nearly an exact match-very minor underperformance while its NII was a minor outperformance.
No change in NYMT’s and OBDC’s percentage recommendation ranges or risk/performance rating. NYMT is currently deemed slightly undervalued (BUY). OBDC is currently deemed appropriately valued (HOLD).
NYMT’s investment portfolio is “riskier” than most sub-sector peers and an investment in its common stock is a “speculative” play. OBDC remains a “fairly good” BDC in my/our opinion.
If OBDC’s quarterly capitalized PIK/deferred income were to decrease below 9.0% in the future, this BDC would be subject to an upgrade.
Introduction:
Hi subscribers. For new members, my name is Scott Kennedy and currently I fully cover 20 mortgage real estate investment trust (mREIT) and 15 business development company (“BDC”) common stocks within this Investing Group regarding research/data, subscriber questions, weekly projected book values/net asset values (BV/NAV), and common stock recommendation ranges. Colorado (“CO”) Wealth Management handles the mREIT preferred stocks and he and his team handles all other applicable REIT sectors outside the mREIT sector. CO also provides some mREIT common stock and BDC articles from time-to-time which are more of an “overview/introduction” discussion; typically based either on my or our combined research/data. This also includes some macroeconomic trends and data. My name is always attached to all Investing Group articles I personally wrote so there is no confusion for subscribers.
This REIT Forum article is part of a series of articles over a span of 6-7 weeks which will analyze my previously projected BV/NAV and core earnings (or core earnings equivalent)/net investment income (“NII”) figures and compare these metrics to each mREIT’s and BDC’s actual reported results, respectively. For readers who are familiar with my public mREIT and/or BDC articles, these types of articles are beneficial to readers who desire to pursue a more active investing strategy and/or want more “real time” thoughts/analysis.
I hope my services/contributions ultimately help enhance a subscriber’s total investment returns or minimize their total investment losses within the mREIT and BDC sectors. At the very least, I hope subscribers will gain more insight into the mREIT and BDC sectors by reading my/our exclusive REIT Forum articles.
1) NYMT’s BV and Net Interest Margin Q4 2023 Performance (Projected Versus Actual Results):
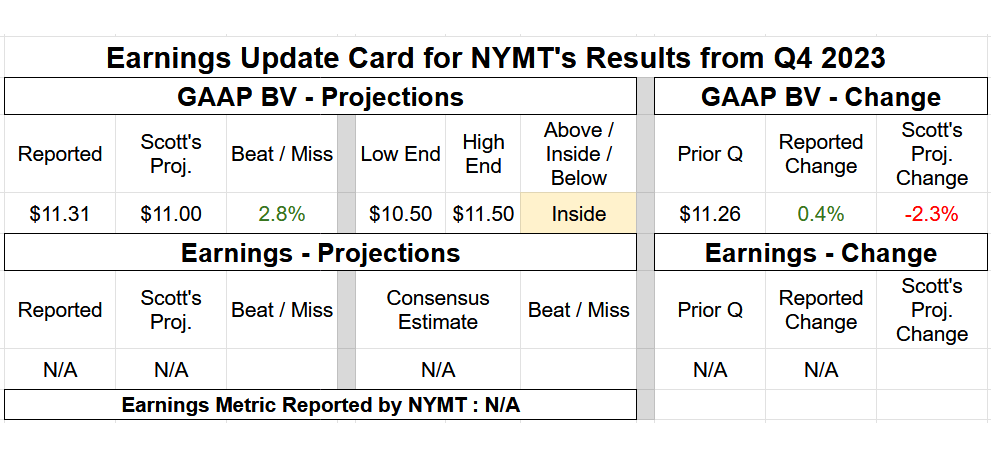
On 2/21/2024, New York Mortgage Trust Inc. NYMT 0.00%↑ reported the company’s earnings results for the fourth quarter of 2023. Table 1 below provides NYMT’s BV and earnings summary.
Table 1 – NYMT Q4 2023 BV and Earnings Summary
Source: Taken Directly from the REIT Forum’s © Analytical Spreadsheets/Data
I provided the following commentary in regards to NYMT’s results for the fourth quarter of 2023:
“Hi subscribers. I was able to review NYMT's Q4 2023 earnings results. NYMT reported a GAAP BV as of 12/31/2023 of $11.31 per common share (0.4% increase) versus my projection of $11.00 per common share (2.3% decrease). I consider this a minor - modest (greater than a 2.5% but less than a 5.0%) outperformance and was within my $10.50 - $11.50 per share range. As such, unlike the prior 2 quarters, a bit of an outperformance on NYMT’s quarterly BV fluctuations. Let us discuss/reconcile this minor - modest BV outperformance.
Regarding compositional changes to NYMT’s investment portfolio, even after purchasing nearly $950 million of fixed-rate agency mortgage-backed securities (“MBS”) during the third quarter of 2023, the company continued to push the “foot down on the accelerator” within this sub-portfolio and purchased $416 million of fixed-rate agency MBS during the fourth quarter of 2023. When calculated, this was a quarterly increase of 26% regarding this sub-portfolio. After doubling NYMT’s fixed-rate agency MBS holdings during the third quarter of 2023, I projected management would “take a breather” per se regarding continuing to expand this sub-portfolio during the fourth quarter of 2023. In addition, NYMT purchased/funded $238 million of new residential whole loans during the fourth quarter of 2023. Unlike the fixed-rate agency MBS sub-portfolio, the increase to this sub-portfolio was correctly anticipated on my end.
NYMT also tried to actively reduce the company’s equity exposure of multi-family properties through the company’s various joint venture (“JV”) agreements (which are financed through non-recourse collateralized loan obligations (“CLO”)/debt obligations (“CDO”). However, as anticipated, this strategy “hit a snag” during the fourth quarter of 2023 as parts of the commercial real estate market basically “froze up”. This actually led to an accounting classification change of many of NYMT’s JV equity investments from “held-for-sale” to real estate owned (“REO”). Simply put, basically no attractive bids during the quarter (nor likely over the foreseeable future). Of NYMT’s investments that were actually sold during the quarter, the company recorded a net realized loss of ($25) million.
NYMT’s leverage as of 12/31/2023 remained fairly low but did have an “uptick”; directly due to the aforementioned continued increase in fixed-rate agency MBS holdings. As of 9/30/2023, NYMT’s investment portfolio had a FMV of $6.4 billion which increased to $6.9 billion as of 12/31/2023. When calculated, this was a quarterly increase of $0.4 billion (rounded) or 7%. In comparison, I projected NYMT’s investment portfolio would increase 0% – 5.0% (mean increase of 2.5%). Since fixed-rate agency MBS pricing notably increased during the quarter across all coupons (and in particular during November – December 2023), having a larger fixed-rate agency MBS sub-portfolio when compared to my expectations directly led to some additional valuation gains. NYMT recorded a combined investment portfolio net valuation gain (both realized and unrealized activity; including derivative instruments) of $38 million during the fourth quarter of 2023. In comparison, I projected NYMT would record a quarterly investment portfolio net valuation gain of only $13 million ($12.5 million to be exact). This was mainly due to a more enhanced fixed-rate agency MBS net valuation gain and slightly lower-than-anticipated impairment within NYMT’s REO investments. When calculated, this $25 million variance directly led to a BV outperformance of $0.28 per common share when compared to my expectations.
When the variance noted above is combined with a BV outperformance of $0.01 per common share from the company’s net margins within its operating real estate sub-portfolio (though overall those margins continue to be disappointing), a less than $0.01 per common share outperformance within its net interest income/margin (discussed next), and a $0.01 per common share outperformance from fractionally more accretive common stock repurchases (very minor amount of common stock was repurchased this quarter; no preferred stock was repurchased), this fully reconciles to the company’s quarterly BV outperformance of $0.31 per common share during the fourth quarter of 2023 when compared to my expectations.
Moving on, unfortunately, NYMT does not provide a core earnings/earnings available for distribution (“EAD”) metric. As such, I cannot provide commentary on that specific metric. That said, NYMT had basically flat net interest income when compared to the prior quarter. In comparison, I also expected basically flat net interest income so basically an exact match within this metric. Even though NYMT increased the company’s fixed-rate agency MBS sub-portfolio during the fourth quarter of 2023, this was basically fully offset by continued high borrowing costs. Simply put, the weighted average coupon (“WAC”) on fixed-rate agency MBS basically continued to match the weighted average interest rate on agency repurchase (“repo”) agreements. NYMT reported net interest income of $16.8 million during the third and fourth quarters of 2023. In comparison, I projected NYMT would report net interest income of $16.5 million. NYMT’s net interest margin increased from 0.90% during the third quarter of 2023 to 1.02% during the fourth quarter of 2023. In comparison, I projected a net interest margin of 0.90% - 1.10% during the fourth quarter of 2023 (mean of 1.00%). This increase mainly occurred within the company’s residential whole loans (as correctly anticipated). As such, basically an exact match regarding NYMT’s net interest income/margin during the fourth quarter of 2023 when compared to my expectations.
So, all-in-all, a minor - modest outperformance on NYMT’s BV (variance of 2.7%) and basically an exact match on the company’s net interest income/margin. As stated 4 quarters ago, I wanted to see management better “time” quarterly asset purchases and sales to stem the severity of BV losses in the current (and projected) interest rate environment. While this occurred during the first quarter of 2023, NYMT took a “step back” during the second and third quarters of 2023. However, management basically held off on disposing of a good chunk of assets during the fourth quarter of 2023. Some will believe this was management expertise. As noted above, others will believe this was just a coincidence as liquidity within commercial real estate notably decreased during the quarter. Personally, I am in the “latter” camp. NYMT’s multifamily JV equity interests will continue to be an issue during 2024 (and possibly beyond). This is NOT a new event. Remember, NYMT has equity interests in these positions when considering credit hierarchy. This has (and will) result in a more severe, permanent loss in BV/capital when compared to first lien debt investments. Simply put, not an “ideal” situation but, again, this is NOT a new development (already factored in my/our modeling and risk ratings). This has been something that has been discussed (and modeled) for at least the past 4 quarters. This outcome only solidifies why I/we have NYMT assigned a risk rating of 5 (underperforming peer).
When taking NYMT’s recent and projected performance into consideration, along with macroeconomic trends/events (mainly Fed monetary policy, the general projected movement of rates/yields, and projected economic performance over the foreseeable future), no change to my/our NYMT percentage recommendation ranges (relative to CURRENT BV) or risk rating (remains at a 5). Remember, I/we continue to have NYMT priced at a discount to the company’s better-run sub-sector peers. Even though NYMT’s recourse leverage is low, outside the recently acquired fixed-rate agency MBS, the remaining composition of the company’s investment portfolio is “riskier” than most sub-sector peers. One also has to consider the GAAP impacts of NYMT’s consolidated variable-interest-entities (“VIE”) and mortgage-related equity investments (as discussed in the past). Due to NYMT’s minor - modest 12/31/2023 BV outperformance, I/we performed a CURRENT BV “true-up” adjustment which raised the company’s per share recommendation ranges by approximately $0.30 per share. This true-up CURRENT BV adjustment is already reflected in the Google subscriber spreadsheets.
At a closing price as of 2/21/2024 of $7.39 per share, NYMT is deemed to be slightly UNDERVALUED/a BUY recommendation (price target of $9.35 per share). Currently, NYMT is not one of the most undervalued mREIT stocks that I/we cover but, in my opinion, is not one of the most overvalued either. However, and I cannot stress this enough, I/we continue to believe an investment in NYMT’s common stock is a “speculative” play. Again, NYMT has a risk rating of 5. Simply put, not a great “fit” for your very cautious – semi-cautious investor…”
2) OBDC’s NAV and NII Q4 2023 Performance (Projected Versus Actual Results):
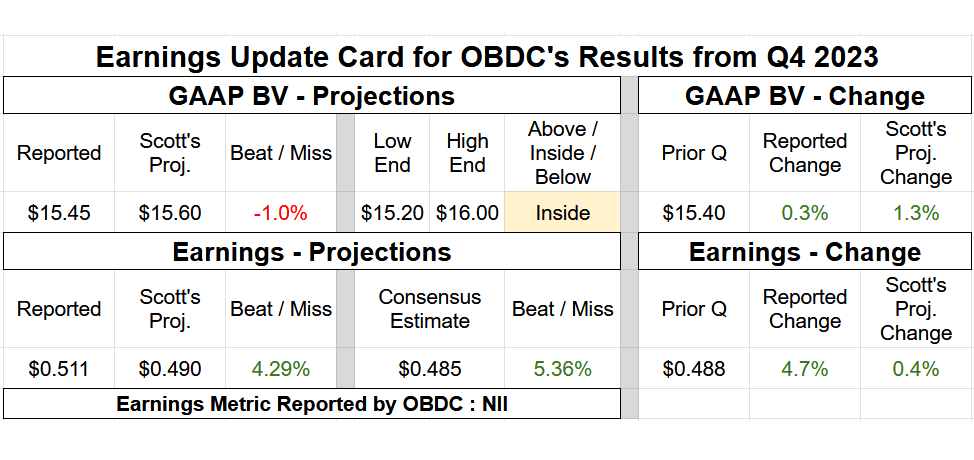
On 2/21/2024, Blue Owl Capital Corp. OBDC 0.00%↑ reported the company’s earnings results for the fourth quarter of 2023. Table 2 below provides OBDC’s NAV and earnings summary.
Table 2 – OBDC Q4 2023 NAV and Earnings Summary
Source: Taken Directly from the REIT Forum’s © Analytical Spreadsheets/Data
I provided the following commentary in regards to OBDC’s results for the fourth quarter of 2023:
“Hi subscribers. I was able to review OBDC’s Q4 2023 earnings results. OBDC's Q4 2023 NII of $0.511 per share was a minor outperformance versus my projection of $0.490 per share (range $0.465 - $0.515 per share). OBDC’s NII was $0.488 per share for the third quarter of 2023. As such, I projected a NII increase of $0.002 per share. In actuality, OBDC reported an increase of $0.023 per share during the fourth quarter of 2023. The institutional analysts’ consensus average was NII of $0.485 per share. Let us discuss how OBDC slightly outperformed my quarterly NII expectations.
First, let us first review OBDC’s quarterly activity within the company’s investment portfolio. OBDC recorded loan originations funded at close and add-on investments of $1.0 billion during the fourth quarter of 2023. In comparison, I projected quarterly loan originations funded at close and add-on investments of $850 - $950 million (mean of $0.9 billion). In addition, OBDC recorded loan prepayments/repayments/restructurings of ($1.1) billion during the fourth quarter of 2023. In comparison, I projected quarterly prepayments/repayments/restructurings of ($1.0) – ($0.9) billion (mean of ($950) million). As such, I projected OBDC’s net fundings would decrease by a mean of ($50) million; prior to fair market value (“FMV”) fluctuations. In actuality, OBDC reported an investment portfolio net fundings decrease of ($112) million during the fourth quarter of 2023. Simply put, a very slightly smaller investment portfolio size when compared to my expectations. When quantified, including the incentive fee offset from lower total pre-incentive fee income strictly on investment portfolio size, this ultimately resulted in a NII underperformance of ($0.004) per share when compared to my expectations.
Second, unlike a majority of sector peers thus far this earnings season, OBDC continued to experience a rise in the company’s weighted average annualized yield during the fourth quarter of 2023 when compared to the prior quarter. Simply put, this was even with the recent “plateauing/leveling off” in LIBOR/SOFR/PRIME. OBDC reported a weighted average annualized yield of 12.20%, 12.30%, and 12.40% for the second, third, and fourth quarter of 2023, respectively. When calculated, this was a quarterly increase of 0.10% and 0.10%, respectively. This past quarter, this was a 0.1% outperformance when compared to my expectations since management previously “hinted” new originations would have yields that were relatively flat – slightly lower versus the existing portfolio. Simply put, this projected management trend actually did not come to fruition during the fourth quarter of 2023. Still, as stated last quarter, this metric will began to plateau towards the end of 2023. In addition, it should be noted the higher LIBOR/SOFR/PRIME rose (over 500 basis points [bps] in 1.5 years), the more underlying credit risk (non-accruals) needs to be respected (and monitored). This will have heightened importance as we head through 2024. When quantified, including the incentive fee offset from higher total pre-incentive fee income, this ultimately resulted in a NII outperformance of $0.022 per share when compared to my expectations.
When the 2 variances above are combined, along with a $0.003 per share NII outperformance within OBDC’s remaining income and expense accounts (outside the incentive fee accrual; mainly due to slightly lower base management fees and interest expense on a slightly smaller investment portfolio size), this fully reconciles back to OBDC’s NII outperformance of $0.021 per share when compared to my expectations for the fourth quarter of 2023.
Moving on, OBDC reported a NAV as of 12/31/2023 of $15.45 per share (0.3% increase) versus my projection of $15.60 per share (1.3% increase). I consider this nearly an exact match (at or within a 1.0% variance) – very minor underperformance and was well within my $15.20 - $16.00 per share range.
OBDC’s very minor underperformance, regarding the company’s quarterly valuation fluctuations, was mainly scattered amongst the company’s 193 portfolio companies as of 12/31/2023. Upon a quick review, a handful of debt/equity investments simply had very slightly - slightly less favorable valuation fluctuations when compared to my expectations. Similar to most BDC peers this quarterly cycle, my NAV estimate was pretty accurate. Regarding OBDC’s entire investment portfolio, the company reported a combined net realized loss and net unrealized depreciation of ($10) million during the fourth quarter of 2023. In comparison, I projected OBDC would report a combined net realized loss and net unrealized appreciation of $55 million. Remember, this variance is in reference to a FMV investment portfolio size of $12.7 billion as of 12/31/2023 (very large when compared to most other BDC covered peers). Hence, this variance should be considered small (0.5% of the portfolio). When calculated, this $65 million variance directly led to a NAV underperformance of ($0.17) per share when compared to my expectations.
When the variance noted above is combined with the NII outperformance of $0.021 per share discussed earlier, this directly calculates to OBDC’s NAV underperformance of ($0.15) per share when compared to my expectations. There were no equity issuances or repurchases during the quarter which was correctly anticipated (hence no NAV variance within the equity section of the balance sheet).
Regarding credit risk, OBDC put 1 new portfolio company on non-accrual status during the fourth quarter of 2023, Ideal Image Development, LLC (Ideal Image). OBDC put 3 first lien debt investments with Ideal Image on non-accrual status which had a total principal balance of $17 million as of 12/31/2023. As such, these should be considered small loans. In addition, 0 portfolio companies were taken off non-accrual status during the quarter. As such, OBDC’s non-accrual percentages remained relatively unchanged during the fourth quarter of 2023 (both amortized cost basis and FMV percentages only increased 0.1%) and were still below the BDC sector peer average. I believe this is a positive catalyst/trend. As of 12/31/2023, OBDC’s non-accrual percentage, based on amortized cost basis and FMV, was 1.1% and 0.9%, respectively. However, I would just quickly point out, sometimes instead of letting troubled portfolio companies simply “sit” on non-accrual status for multiple quarters as some other BDC peers do, OBDC can be quick/active in restructuring/exiting. That said, this strategy did not occur this quarter (but did occur during the third quarter of 2023). As such, OBDC’s non-accrual percentages can be a bit “deceiving” at times. I continue to anticipate a general rise in credit risk during 2024 – early 2025. At this point in time, just something to keep note of.
So, all-in-all, a minor outperformance on OBDC’s NII (variance of $0.021 per share) and nearly an exact match – very minor underperformance on the company's NAV (variance of 1.0%). That said, I was a bit disappointed OBDC’s capitalized payment-in-kind (“PIK”)/deferred income (as a percentage of total investment income) remained unchanged at 11.9% during the fourth quarter of 2023 when compared to the prior quarter. This percentage remains very high. For example, 13.3%, 13.6%, 15.8%, and 11.9% of OBDC’s total investment income was attributable to capitalized PIK/deferred income during the fourth quarter of 2022 - third quarter of 2023, respectively. As stated for the past several quarters, I wanted to see this percentage decrease in future quarters. As noted above, a decrease occurred during the third quarter of 2023 (which led to a recommendation range upgrade) but did not occur during the fourth quarter of 2023.
Regarding OBDC’s dividend, it was not a surprise the company declared a $0.02 per share increase to the company’s quarterly base dividend ($0.37 per share for the first quarter of 2024 compared to $0.35 per share for the fourth quarter of 2023). In addition, it was not a surprise OBDC declared an unchanged special periodic dividend ($0.08 per share for the first quarter of 2024 compared to $0.08 per share for the fourth quarter of 2023). Both declarations were within my previously projected ranges (as shown in last quarter’s BDC sector comparison article [PART 2]). OBDC continued to have a modest cumulative undistributed taxable income (“UTI”) balance as of 12/31/2023.
When taking OBDC’s recent and projected performance into consideration, along with macroeconomic trends/events (mainly Fed monetary policy, the general projected movement of rates/yields, and projected economic performance over the foreseeable future), no change to my/our OBDC percentage recommendation ranges (relative to CURRENT NAV) or risk/performance rating (remains at a 3.5). OBDC remains a “fairly good” BDC in my/our opinion.
At a closing price as of 2/21/2024 of $15.00 per share, OBDC is deemed to be APPROPRIATELY VALUED/a HOLD recommendation (price target of $15.85 per share). Therefore, OBDC is currently not the most undervalued BDC stock that I/we cover but, in my opinion, is far from being one of the most overvalued either. So, another pretty good quarter for OBDC but still be mindful of that very high capitalized PIK/deferred income percentage. In my professional opinion, that metric is still an “eye sore” and could potentially eventually lead to trouble down-the-road regarding large PIK reversals/unrealized depreciation/write-offs (which would generally be dependent on the U.S. economy over the foreseeable future). If OBDC’s quarterly capitalized PIK/deferred income were to increase back above 12.0% in the future, this BDC would likely be subject to a future downgrade back down to previous ranges. However, if this percentage were to decrease below 9.0%, this BDC would likely be subject to another upgrade…”