

Scott Kennedy’s mREIT And BDC Earnings Series: Assessing Annaly Capital’s And PennantPark Floating Rate Capital’s Performance For Q4 2023
Scott Kennedy’s mREIT And BDC Earnings Series: Assessing Annaly Capital’s And PennantPark Floating Rate Capital’s Performance For Q4 2023

Introduction section by Colorado Wealth Management Fund.
Article section by Scott Kennedy.
Bringing More of Scott’s Work to Our Website
The REIT Forum is a service produced by Michael Vanloon (better known as Colorado Wealth Management Fund) and Scott Kennedy. After intense consideration, I decided to launch our service through Substack. Since then, we’ve seen great success. Substack enables us to give readers real-time alerts with entire articles delivered directly to their inboxes.
You’re probably used to seeing the “from” field saying: “ColoradoWealthManagementFund from The REIT Forum”.
In some of our future e-mails, it may say:
“Scott Kennedy from The REIT Forum”.
That will simply mean we’ve updated the backend of the website for Scott Kennedy to directly post his articles.
I want to make browsing our work as simple as possible for readers. This will be another step in that direction.
For the moment, I’ll be posting Scott’s work. The following articles are a direct copy and paste from Scott. While we get the back end set up, there is a delay in getting the articles posted. Rest assured that it should be solved soon.
Finding Our Positions
I posted a subscriber-exclusive article with links to our Google Sheets. You can always access our positions there. Scott’s positions are updated each week. CWMF’s positions are usually updated on the same day as the trade.
Disclosures
Related to the stocks in this article:
CWMF is long: RITM-D, GPMT-A, DX-C, EFC-A, RITM-C, EFC-B, PMT-C, AGNCP, CIM-D, RITM-B, RITM, SLRC, GPMT, RC.
Scott Kennedy is long: RITM, RC, SLRC, GPMT, ARCC, GBDC, RITM-D, MITT-B, MITT-C, GAINL, ECCC.
The rest of this post is from Scott Kennedy.
Summary
This 10th earnings assessment article reviews NLY’s and PFLT’s BV/NAV and core earnings/NII performance during Q4 2023.
This article also discusses how NLY’s and PFLT’s quarterly change in BV/NAV and core earnings/NII “matched up” to expectations. Earnings remain a key driver to stock performance.
NLY’s BV was a minor-modest outperformance while its core earnings was nearly an exact match-very minor outperformance. NLY should declare an unchanged dividend for Q1 2024.
PFLT’s NAV was nearly an exact match-very minor underperformance while its NII was nearly an exact match-very minor outperformance. Before upgrading PFLT, I want NII to reach $0.35 per share.
No change in NLY’s and PFLT’s percentage recommendation ranges or risk/performance rating. NLY is currently deemed appropriately valued (HOLD). PFLT is currently deemed overvalued (SELL).
Introduction:
Hi subscribers. For new members, my name is Scott Kennedy and currently I fully cover 20 mortgage real estate investment trust (mREIT) and 15 business development company (“BDC”) common stocks within this Investing Group regarding research/data, subscriber questions, weekly projected book values/net asset values (BV/NAV), and common stock recommendation ranges. Colorado (“CO”) Wealth Management handles the mREIT preferred stocks and he and his team handles all other applicable REIT sectors outside the mREIT sector. CO also provides some mREIT common stock and BDC articles from time-to-time which are more of an “overview/introduction” discussion; typically based either on my or our combined research/data. This also includes some macroeconomic trends and data. My name is always attached to all Investing Group articles I personally wrote so there is no confusion for subscribers.
This REIT Forum article is part of a series of articles over a span of 6-7 weeks which will analyze my previously projected BV/NAV and core earnings (or core earnings equivalent)/net investment income (“NII”) figures and compare these metrics to each mREIT’s and BDC’s actual reported results, respectively. For readers who are familiar with my public mREIT and/or BDC articles, these types of articles are beneficial to readers who desire to pursue a more active investing strategy and/or want more “real time” thoughts/analysis.
I hope my services/contributions ultimately help enhance a subscriber’s total investment returns or minimize their total investment losses within the mREIT and BDC sectors. At the very least, I hope subscribers will gain more insight into the mREIT and BDC sectors by reading my/our exclusive REIT Forum articles.
1) NLY’s BV and Core Earnings Q4 2023 Performance (Projected Versus Actual Results):
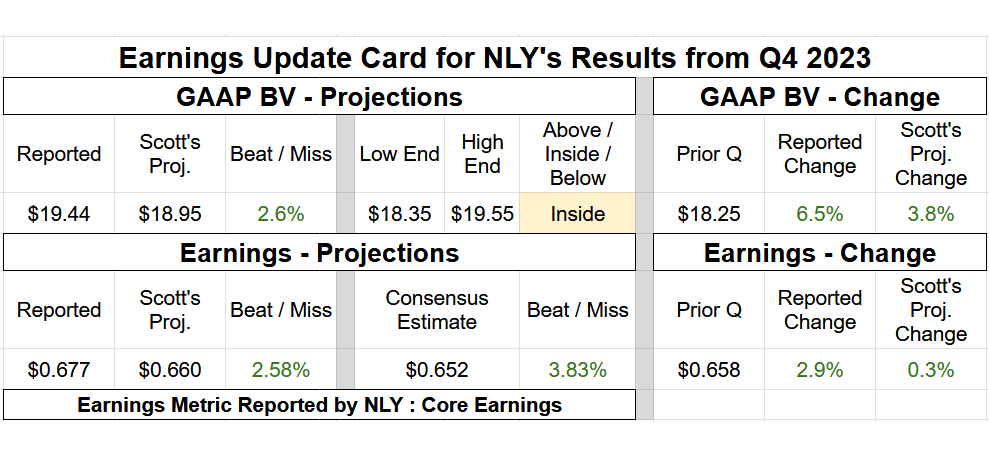
On 2/7/2024, Annaly Capital Management Inc. (NLY) reported the company’s earnings results for the fourth quarter of 2023. Table 1 below provides NLY’s BV and earnings summary.
Table 1 – NLY Q4 2023 BV and Earnings Summary
Source: Taken Directly from the REIT Forum’s © Analytical Spreadsheets/Data
I provided the following commentary in regards to NLY’s results for the fourth quarter of 2023:
“Hi subscribers. I was able to review NLY's Q4 2023 earnings results. NLY reported a BV as of 12/31/2023 of $19.44 per common share (6.5% increase) versus my prior projection of $18.95 per common share (3.9% increase). I consider this a minor - modest (at or greater than a 2.5% but less than a 5.0%) outperformance and was within my $18.35 - $19.55 per common share range (towards the top end).
I would point out the extreme volatility, especially for the agency mREIT model, during the fourth quarter of 2023. BVs notably decreased during September 2023 (some peers in excess of 15%) which quickly “reversed course” during November - December 2023. In my personal opinion, any quarterly BV variance at or within 4% this particular quarter should really be considered an accurate estimate (larger “cone” per se). In addition, as a reminder, the current subscriber spreadsheets are based on CURRENT BVs. For example, currently each company’s BV estimate as of 2/2/2024. In this note, I am comparing 12/31/2023 BV projections versus actual results. Something to mention for newer subscribers. Since this was a 2.6% quarterly BV outperformance, let me provide a full reconciliation to specifically see where NLY slightly – modestly exceeded my expectations.
First, when reviewing NLY’s mortgage-backed securities (“MBS”)/investment sub-portfolio, there really were no notable surprises that “sprung up”. On top of the anticipated minor on-balance sheet agency MBS “run-off”, NLY continued to increase the company’s non-agency MBS/residential whole loan/securitized and mortgage servicing rights (“MSR”) sub-portfolios. All this was correctly anticipated. NLY’s total on-balance sheet MBS/investment portfolio increased 2% during the fourth quarter of 2023 when based on fair market value (“FMV”) fluctuations. In comparison, knowing NLY did not perform any bulk equity offerings during the quarter, I projected a total on-balance sheet MBS/investment portfolio mean fluctuation of 0%. As such, nearly an exact match but technically a slightly larger total investment portfolio size which benefited BV a bit more. When combined, NLY reported a MBS/investment net valuation gain of $3.28 billion during the fourth quarter of 2023. In comparison, I projected a MBS/investment net valuation gain of $3.22 billion. When calculated, this $57 million variance directly led to a BV outperformance of $0.12 per common share.
Second, when reviewing NLY’s derivative instruments sub-portfolio, the company’s quarterly valuation fluctuations slightly – modestly exceeded my expectations (less severe decrease). This was mainly due to the fact NLY realized that mortgage interest rates/long-term U.S. Treasury yields were sharply declining during November – December 2023 and quickly reduced a notable proportion of the company’s net (short) U.S. Treasury futures during the fourth quarter of 2023. As a result, NLY’s hedging coverage ratio decreased from 115% as of 9/30/2023 to 107% as of 12/31/2023. In comparison, I projected an unchanged hedging coverage ratio of 115% as of 12/31/2023 with only a minor reduction to NLY’s net (short) U.S. Treasury futures position. When combined, NLY reported a derivatives net valuation loss of ($2.30) billion during the fourth quarter of 2023. In comparison, I projected a derivatives net valuation loss of ($2.48) billion. When calculated, this $173 million variance directly led to a BV outperformance of $0.35 per common share.
When the 2 variances noted above are combined, along with a normalized core earnings/earnings available for distribution (NCE/EAD) outperformance of $0.017 per common share (which will be discussed next) and de minimis equity activity, this fully reconciles to NLY’s BV outperformance of $0.49 per common share when compared to my expectations.
Moving on, NLY’s NCE/EAD of $0.677 per common share for the fourth quarter of 2023 was nearly an exact match - very minor outperformance versus my prior projection of $0.660 per common share (range $0.620 - $0.700 per share). NLY’s NCE/EAD was $0.658 per common share for the third quarter of 2023. As such, I projected a NCE/EAD increase of $0.002 per common share. In actuality, NLY reported a NCE/EAD increase of $0.019 per common share. The institutional analysts’ consensus average was NCE/EAD of $0.652 per common share for the fourth quarter of 2023.
First, NLY continued to suppress the utilization of net long “to-be-announced” (“TBA”) MBS as dollar roll “specialness” continued to wane (but starting to slightly improve by quarter-end as spread/basis risk quickly declined). As noted 2 quarters ago, dollar roll specialness really dried up during 2023 as demand for generic MBS quickly waned (mainly due to rapidly rising mortgage interest rates/U.S. Treasury yields). NLY reported net dollar roll (“NDR”) income of $2 million during the fourth quarter of 2023. In comparison, I projected NDR income of $3 million. When calculated, this ($1) million variance directly led to a NCE/EAD underperformance of only ($0.002) per common share.
Second, NLY very slightly increased the company’s interest rate payer swaps during the fourth quarter of 2023. In comparison, I assumed NLY would add a slightly larger amount of new interest rate payer swap contracts towards the longer-end of the yield curve which would have directly led to a slightly lower net receive rate. As such, this resulted in a slightly higher amount of current period hedging income being reported when compared to my expectations. NLY reported current period interest income from interest rate swaps of $379 million during the fourth quarter of 2023. In comparison, I projected current period interest income from interest rate swaps of $370 million. When calculated, this $9 million variance directly led to a NCE/EAD outperformance of $0.017 per common share.
When the 2 variances noted above are combined, along with a remaining NCE/EAD net outperformance of $0.002 per common share (mainly very slightly higher net spread income on non-agency MBS/investment yields), this fully reconciles to NLY’s NCE/EAD outperformance of $0.017 per common share during the fourth quarter of 2023 when compared to my expectations.
So, all-in-all, a minor – modest outperformance on NLY’s BV (variance of 2.6%) and nearly an exact match - very minor outperformance on the company’s NCE/EAD (variance of only $0.017 per share). Regarding NLY’s dividend sustainability, I continue to believe there is low risk regarding a reduction for first quarter of 2024. NLY fairly recently had a large dividend per share rate “reset” that management continues to believe can be sustained over the foreseeable future. I continue to believe we are nearing a “trough/low point” regarding sub-sector core earnings/EAD (late 2023 – early 2024). I believe we saw this trend within NLY for the fourth quarter of 2023 (slight improvement). That said, quarterly EAD improvements are going to be GRADUAL and will NOT be a “linear” relationship. Simply put, slow NET improvement over time (will not see an improvement each and every quarter).
When taking NLY’s recent and projected performance into consideration, along with macroeconomic trends/events (mainly Fed monetary policy, the general projected movement of rates/yields, and projected economic performance over the foreseeable future), no change to my/our NLY percentage recommendation ranges (relative to CURRENT BV) or risk/performance rating (remains at a 3.5). I correctly projected NLY would record a more enhanced quarterly BV increase (a positive catalyst/trend) when compared to sub-sector peers. However, I believe NLY’s current market valuation basically already factors in this notion.
At a closing price as of 2/8/2024 of $18.81 per share, NLY is deemed to be APPROPRIATELY VALUED/a HOLD recommendation (price target of $19.75 per share). As such, NLY currently does not present “great” value but its valuation is not “horrible” either. With the market’s recent sector sell-off, NLY is beginning to show a bit of value when compared to the prior several months. However, before I consider an investment in NLY, I first want to see continued spread stabilization that lasts more than a couple weeks and the stock price to move into our UNDERVALUED/BUY recommendation range (which currently starts at $17.80 per share)…”
2) PFLT’s NAV and NII Calendar Q4 2023 Performance (Projected Versus Actual Results):
On 2/7/2024, PennantPark Floating Rate Capital Ltd. (PFLT) reported the company’s earnings results for the calendar fourth quarter of 2023 (fiscal first quarter of 2024). Table 2 below provides PFLT’s NAV and earnings summary.
Table 2 – PFLT Calendar Q4 2023 NAV and Earnings Summary

Source: Taken Directly from the REIT Forum’s © Analytical Spreadsheets/Data
I provided the following commentary in regards to PFLT’s results for the calendar fourth quarter of 2023:
“Hi subscribers. I was able to review PFLT’s calendar Q4 2023 (fiscal Q1 2024) earnings results. PFLT's calendar Q4 2023 net investment income (“NII”) of $0.331 per share was nearly an exact match - very minor outperformance versus my projection of $0.320 per share (range $0.295 - $0.345 per share). PFLT’s NII for the calendar third quarter of 2023 was $0.324 per share. As such, I projected a NII decrease of ($0.004) per share. In actuality, PFLT reported a NII increase of $0.007 per share during the calendar fourth quarter of 2023. The institutional analysts’ consensus average was NII of $0.313 per share. Let us discuss how PFLT very slightly outperformed my quarterly NII expectations.
First, regarding quarterly investment activity, I generally correctly anticipated a sizable “up-tick” in loan originations. That said, the size of this increase was even a bit larger than I anticipated. PFLT recorded loan originations funded at close and add-on investments of $303 million during the calendar fourth quarter of 2023 which was proportionately notably larger when compared to just $94 million during the prior quarter. In comparison, I projected quarterly loan originations funded at close and add-on investments of $225 - $275 million (mean of $250 million). In addition, PFLT recorded loan prepayments/repayments/restructurings of ($104) million during the calendar fourth quarter of 2023. In comparison, I projected quarterly prepayments/repayments/restructurings of ($75) – ($125) million (mean of ($100) million). When calculated, excluding fair market value (“FMV”) fluctuations, PFLT increased the company’s investment portfolio size by $199 million during the calendar fourth quarter of 2023. In comparison, I projected PFLT would increase the company’s investment portfolio size by $150 million. So, a slightly larger investment portfolio size when compared to my expectations. When quantified, including the incentive fee offset from higher total pre-incentive fee income, this ultimately resulted in a NII outperformance of $0.021 per share when compared to my expectations.
Now, some subscribers may be wondering if management grew PFLT’s investment portfolio size by 19% during the calendar fourth quarter of 2023, why did the company only report a quarterly NII increase of $0.007 per share (less than one cent)? Two reasons. First, most of these loan originations occurred towards the end of the quarter. Second, PFLT had $76 million of the company’s 2023 4.30% unsecured notes maturing during the calendar fourth quarter of 2023. To repay this debt (and fund the new loan originations noted above), PFLT used the company’s largely “idle” revolving credit facility which had an effective interest rate of approximately 7.75%. Both factors directly caused PFLT’s cost of funds rate to increase nearly 100 basis points (“bps”) within just one quarter. As implied by my PFLT quarterly NII projection, I correctly anticipated a pretty sizable increase in the company’s cost of funds rate during this quarter.
Second, unlike the generalized pattern that developed during 2022 – 2023, PFLT experienced a decrease in the company’s weighted average annualized yield during the calendar fourth quarter of 2023 when compared to the prior quarter. Simply put, this was mainly due to the recent “plateauing/leveling off” in LIBOR/SOFR/PRIME. PFLT reported a weighted average annualized yield of 12.40%, 12.60%, and 12.50% for the calendar second, third, and fourth quarter of 2023, respectively. When calculated, this was a quarterly increase of 0.20% and decrease of (0.10%), respectively. This past quarter, this matched my expectations. As correctly stated last quarter, this metric began to plateau towards the end of 2023. In addition, it should be noted the higher LIBOR/SOFR/PRIME rose (over 500 basis points [bps] in 1.5 years), the more underlying credit risk (non-accruals) needs to be respected (and monitored). This will have heightened importance as we head through 2024 as well. When quantified, including the incentive fee offset from similar total pre-incentive fee income (not applicable in this specific case), this directly led to no/a de minimis NII variance when compared to my expectations.
When the 2 variances noted above are combined, along with a remaining NII underperformance of ($0.010) per share mainly scattered amongst PFLT’s expense accounts (mainly higher base management fees and interest expense on a slightly larger investment portfolio size), this fully reconciles to the company’s quarterly NII outperformance of $0.011 per share during the calendar fourth quarter of 2023 when compared to my expectations.
Moving on, PFLT reported a NAV as of 12/31/2023 of $11.20 per share (0.6% increase) versus my projection of $11.30 per share (1.5% increase). I consider this nearly an exact match (at or within a 1.0% variance) – very minor underperformance and was well within my $10.95 - $11.65 per share range.
Upon a quick “scan” of PFLT’s entire investment portfolio, which contained 141 portfolio companies as of 12/31/2023, I saw no notable valuation fluctuations when compared to my modeling. Simply put, this very minor variance was scattered amongst PFLT’s investment portfolio. PFLT reported a combined net realized loss and net unrealized appreciation of $3 million during the calendar fourth quarter of 2023. In comparison, I projected PFLT would report a combined net realized loss and net unrealized appreciation of $10 million. When calculated, this ($7) million variance directly led to a NAV underperformance of ($0.10) per share when compared to my expectations.
When this variance is combined with the aforementioned NII outperformance of $0.011 per share discussed earlier and a NAV underperformance of ($0.01) per share regarding the quarterly FMV fluctuations of the company’s outstanding borrowings (liabilities; deemed immaterial for discussion), this directly reconciles back to PFLT’s NAV underperformance of ($0.10) per share when compared to my expectations.
Regarding credit risk, PFLT put 0 new portfolio companies on non-accrual status during the calendar fourth quarter of 2023. In addition, 2 portfolio companies were taken off non-accrual status, Lucky Bucks LLC (Lucky Bucks) and Output Services Group Inc. (Output). Both portfolio companies were discussed in my/our PFLT earnings note for the calendar first quarter of 2023 (the quarter they were put on non-accrual status). Both portfolio companies had a partial debt-to-equity restructuring during the quarter. Both portfolio companies also had new debt investments created in the process (smaller in size when compared to the already small-sized legacy debt investments). As a part of this restructuring, the new debt investments were placed on accrual status during the calendar fourth quarter of 2023. This had a de minimis impact to PFLT’s quarterly NII (very small investment size). Looking ahead, Efficient Collaborative Retail Marketing Company LLC (Retail), Research Now Group, Inc. and Dynata, LLC (Research Now), a recently restructured Walker Edison Furniture LLC (Walker Edison), and the recently restructured Lucky Bucks and Output will continue to have heightened credit monitoring. Retail (and perhaps Research Now) could be placed on non-accrual status as early as the calendar first quarter of 2024.
So, all-in-all, a very minor outperformance on PFLT’s NII (variance of only $0.011 per share) and a very minor underperformance on the company’s NAV (variance of only 0.9%). I believe PFLT reported another “average” quarter regarding NII and NAV fluctuations (not “horrific”, not great).
When taking PFLT’s recent and projected performance into consideration, along with macroeconomic trends/events (mainly Fed monetary policy, the general projected movement of rates/yields, and projected economic performance over the foreseeable future), no change to my/our PFLT percentage recommendation ranges (relative to CURRENT NAV) or risk rating (remains at a 4). PFLT remains an “average” BDC in my/our opinion. If PFLT could have generated NII at or above $0.35 per share (which did NOT occur), kept non-accruals in check (which occurred), AND kept NAV relatively unchanged or reported an increase (which occurred), I would have performed a percentage recommendation range (relative to CURRENT NAV) upgrade. If this upgrade had occurred, this would have also resulted in a risk/performance rating upgrade from 4 to 3.5. However, the NII “target/goal” was not met once again this quarter. As such, I do not believe PFLT’s performance this quarter justifies an upgrade YET. This is something to point out to subscribers.
An upgrade could occur as early as next quarter if PFLT continues to put new capital to work in investments with low credit risk and attractive risk-adjusted returns (thus resulting in a modest increase in quarterly NII past $0.35 per share solely with recurring income). I am projecting a PFLT quarterly NII increase next quarter. Let us see if it can surpass $0.35 per share prior to an upgrade.
At a closing price as of 2/8/2024 of $11.30 per share, PFLT is deemed to be modestly OVERVALUED/a SELL recommendation (price target of $10.35 per share). As such, I/we currently deem PFLT is not attractively valued. Therefore, subscribers should not currently initiate or add to one’s existing position. In my opinion, a modest - notable pullback in PFLT’s stock price would first need to occur…”