

Scott Kennedy’s BDC Series: Ares Capital’s NAV, Valuation, And Dividend Versus 14 BDC Peers – Part 2 (Includes Cal Q1 2024/Next Series Of Dividend Projections For All Covered Peers)
Scott Kennedy’s BDC Series: Ares Capital’s NAV, Valuation, And Dividend Versus 14 BDC Peers – Part 2 (Includes Cal Q1 2024/Next Series Of Dividend Projections For All Covered Peers)

Introduction section by Colorado Wealth Management Fund.
Article section by Scott Kennedy.
Bringing More of Scott’s Work to Our Website
The REIT Forum is a service produced by Michael Vanloon (better known as Colorado Wealth Management Fund) and Scott Kennedy. After intense consideration, I decided to launch our service through Substack. Since then, we’ve seen great success. Substack enables us to give readers real-time alerts with entire articles delivered directly to their inboxes.
You’re probably used to seeing the “from” field saying: “ColoradoWealthManagementFund from The REIT Forum”.
In some of our future e-mails, it may say:
“Scott Kennedy from The REIT Forum”.
That will simply mean we’ve updated the backend of the website for Scott Kennedy to directly post his articles.
I want to make browsing our work as simple as possible for readers. This will be another step in that direction.
For the moment, I’ll be posting Scott’s work. The following articles are a direct copy and paste from Scott. While we get the back end set up, there is a delay in getting the articles posted. Rest assured that it should be solved soon.
Finding Our Positions
I posted a subscriber-exclusive article with links to our Google Sheets. You can always access our positions there. Scott’s positions are updated each week. CWMF’s positions are usually updated on the same day as the trade.
Disclosures
Related to the stocks in this article:
CWMF is long: RITM-D, GPMT-A, DX-C, EFC-A, RITM-C, EFC-B, PMT-C, PMT-B, AGNCP, CIM-D, RITM-B, RITM, SLRC, GPMT, RC.
Scott Kennedy is long: RITM, RC, SLRC, GPMT, ARCC, GBDC, RITM-D, MITT-B, MITT-C, GAINL, ECCC, ECCW.
The rest of this post is from Scott Kennedy.
Summary
Part 2 of this article compares ARCC’s recent dividend per share rates, yield percentages, and several other highly detailed (and useful) dividend sustainability metrics to 14 other BDC peers.
This includes a comparative analysis of ARCC’s cumulative undistributed taxable income ratio, percentage of floating-rate debt investments, recent weighted average annualized yield, and weighted average interest rate on outstanding borrowings.
ARCC’s dividend sustainability remains one of the highest in the sector. When comparing/analyzing all metrics (including additional metrics not mentioned), ARCC is currently deemed to be slightly undervalued (BUY).
Most BDCs will continue to have sustainable-slightly growing (and some special periodic) dividends over the foreseeable future. However, credit risk will rise heading into 2024 (something I will continually monitor/model).
The REIT Forum subscribers receive additional data within 5 tables which include dividend per share rate ranges (and probabilities) regarding all 15 BDC peers I/we currently cover for Q1 2024.

Author’s Note: This is an “early look” for the REIT Forum subscribers regarding PART 2 of my quarterly business development company (“BDC”) sector comparison article. While I will be providing this article to the public in the near future, this “version” of the article per se provides one key metric in any BDC dividend sustainability analysis, its cumulative undistributable taxable income (“UTI”). Simply put, this metric has a direct impact on a BDC’s future dividend sustainability. In order to provide this specific data/metric each quarter, I believe one needs an extensive knowledge of taxation metrics and Internal Revenue Code (“IRC”) methodologies. I have calculated/provided/projected taxation metrics on Seeking Alpha since 2013 via my public BDC articles but decided, since joining the REIT Forum, this metric will solely be for subscribers on a going forward basis. This also includes five separately-ranked tables for more effective sector comparative metrics and dividend per share projections and probabilities for all 15 BDC peers I currently cover (public will only receive ARCC’s dividend projection and probability for the first and second quarters of 2024). In the future, subscribers will get additional early looks regarding mortgage real estate investment trust (mREIT) and BDC articles I provide to the public, along with additional data/metrics and per share price ranges. Furthermore, this includes mREIT and BDC earnings articles and weekly recommendation change articles that are only provided to subscribers of the REIT Forum. This also includes “real time” (same day) purchase and sale disclosures regarding my personal holdings/portfolio.
Focus of Article:
The focus of this two-part article is a very detailed analysis comparing Ares Capital Corp. (ARCC) to some of the company’s BDC peers (all sector peers I currently fully cover). I am writing this two-part article due to the continued requests that such an analysis be specifically performed on ARCC and some of the company’s BDC peers at periodic intervals. For readers who just want the summarized conclusions/results, I would suggest to scroll down to the “Conclusions Drawn” section at the bottom of each part of the article.
PART 1 of this article analyzed ARCC’s recent quarterly results and compared several of the company’s metrics to 14 other BDC peers. PART 1 helps lead to a better understanding of the topics and analysis that will be discussed in PART 2. The link to PART 1’s analysis is provided below:
REIT Forum Version (Expanded Analytics/Sorted Tables):
PART 2 of this article compares ARCC’s recent dividend per share rates, yield percentages, and several other highly unique dividend sustainability metrics to 14 other BDC peers. This analysis will show recent past data with supporting documentation within Table 3 below. This article will also provide ARCC’s dividend sustainability projection for the calendar first and second quarters of 2024 which is partially based on the metrics shown in Table 3 and several additional metrics shown in Table 4 below.
By analyzing these metrics, one will better understand which BDC generally has a safer dividend rate going forward versus other peers who have a higher risk for a dividend decrease or a higher probability of a dividend increase and/or a special periodic dividend being declared. This is not the only data that should be examined to initiate a position within a particular stock/sector or project future dividend per share rates. However, I believe this analysis would be a good “starting-point” to begin a discussion on the topic. At the end of this article, there will be a conclusion regarding various comparisons between ARCC and the 14 other BDC peers. In addition, I will provide my current BUY, SELL, or HOLD recommendation and price target on ARCC. Dividend projections for the calendar first quarter of 2024 (or next set of dividend declarations) and excess taxable income balances for the other 14 BDC peers are exclusive to our subscribers.
Side Note: As of 12/15/2023, MidCap Financial Investment Corp. (MFIC), ARCC, Oaktree Specialty Lending Corp. (OCSL), FS KKR Capital Corp. (FSK), Gladstone Investment Corp. (GAIN), Golub Capital BDC Inc. (GBDC), SLR Investment Corp. (SLRC), Blackrock (BLK) TCP Capital Corp. (TCPC), Sixth Street Specialty Lending Inc. (TSLX), Capital Southwest Corp. (CSWC), PennantPark Floating Rate Capital Ltd. (PFLT), and TriplePoint Venture Growth BDC Corp. (TPVG) had a stock price that “reset” lower regarding each company’s regular monthly/quarterly dividend accrual. In other words, this company’s “ex-dividend date” has occurred. In addition, OCSL, FSK, GAIN, GBDC, TCPC, TSLX, CSWC, and Blue Owl Capital Corp. (OBDC) (formerly ORCC) had a stock price that reset lower regarding each company’s special periodic dividend accrual. Main Street Capital Corp. (MAIN), Prospect Capital Corp. (PSEC), and OBDC had a stock price that had not reset lower regarding each company’s regular December 2023 monthly/quarterly dividend accrual. MAIN had a stock price that has not reset lower regarding the company’s special periodic dividend accrual. Readers should take this into consideration as the analysis is presented below.
Dividend Per Share Rates and Yield Percentages Analysis - Overview:
Let us start this analysis by first getting accustomed to the information provided in Table 3 below. This will be beneficial when comparing ARCC to the 14 other BDC peers regarding quarterly dividend per share rates and yield percentages.
Table 3 – Dividend Per Share Rates and Yield Percentages
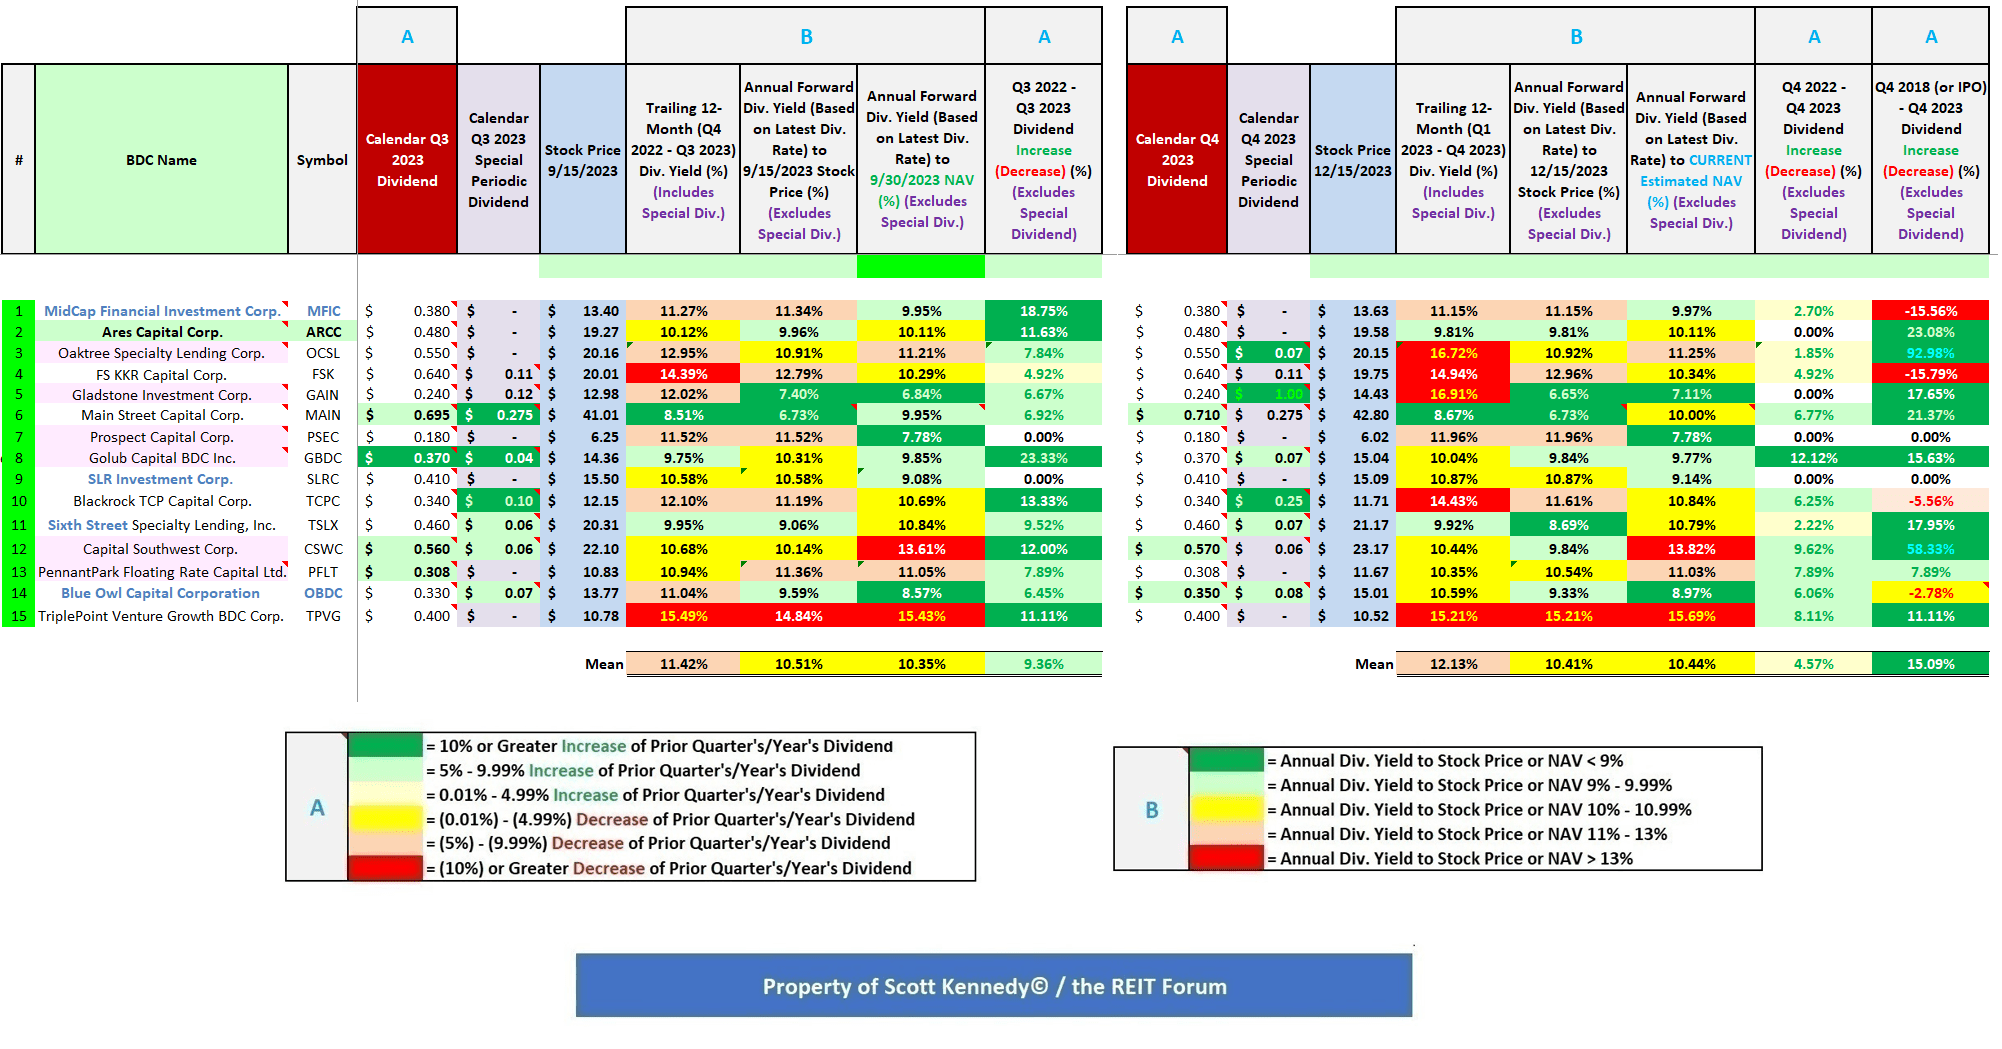
(Source: Table created entirely by myself, obtaining historical stock prices from NASDAQ and each company’s dividend per share rates from the SEC’s EDGAR Database)