
Portfolio Update - May: Anything Beats April
April was a rough month. Interest rates had bounced around in March, but started and ended at similar levels.
The end of April saw the 2-year Treasury break over 5%, before retreating to 4.73% as of 05/15/2024.
Since REITs tend to be sensitive to interest rates, it’s probably no surprise that our portfolio value dipped in April (along with all REIT indexes).
Likewise, we’re seeing a nice bounce in the first half of March as rates dipped.
When interest rates are relatively low, the correlation between REITs and bonds tends to be lower. However, we’ve seen a stronger correlation with real yields at elevated levels.
Think real yields are not elevated? Consider the last 20 years:
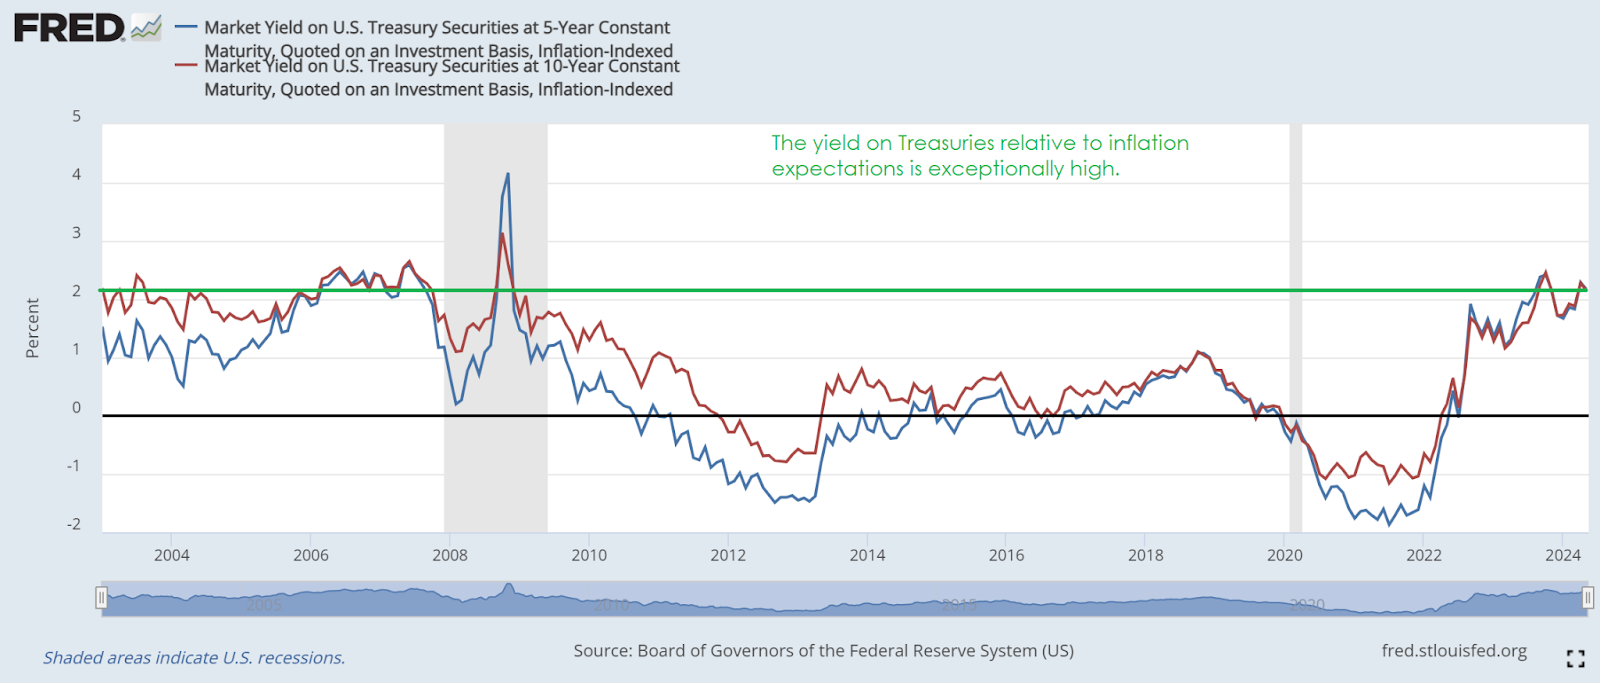
Even before the GFC (Global Financial Crisis), real yields barely broke 2%.
Is the argument really going to be that 20-years is too small as a sample period?
Are higher rates working to stop inflation? It doesn’t feel like it. There’s no evidence for it. The CPI (Consumer Price Index) uses some severely lagged data to smooth out inflation. By the time the Federal Reserve was raising rates, the market was already tackling high prices.
I want to bring in a quote from another good macro analyst:
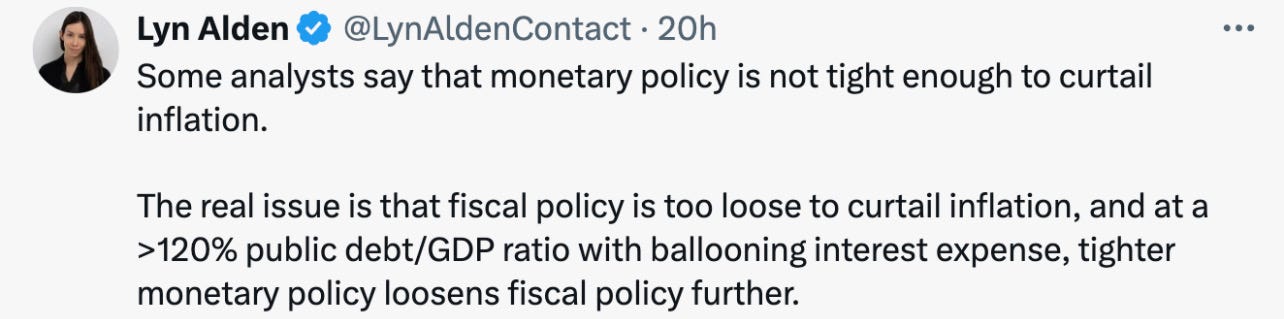
That’s the issue. If public debt to GDP was very low, then raising rates would have minimal impact on fiscal policy.
However, decades of deficits resulted in a very large amount of public debt.
Many people will argue that monetary policy (interest rates) is the job of the Federal Reserve and they are not responsible for fiscal policy.
However, fiscal policy (deficits, because we don’t do surpluses) includes interest expense.
The Federal Reserve is setting part of fiscal policy, whether they want to admit it or not.
They 100% don’t want to admit it.
Article Starts
You can find prior installments of the Portfolio Updates on the Portfolio tab of our website.
Older editions of the Portfolio Update are unlocked for everyone. The newest release reserves the foreshadowing section for paid members.
Trade Alerts
We have a page on Substack to link all trade alert articles.
Here are The REIT Forum’s trade alerts.
Layout - Modified Order
To keep things simple for our investors, the rest of the portfolio update is divided into several segments. We run the same segments (with new content) each week.
We usually maintain the same order from month to month, but I revised the order to work better with free previews. Eventually, the order will be locked in again.
- Returns on Total Portfolio
- Sector Allocation
- Reminder About Cash
- Housekeeping
- Recently Closed Positions with Returns
- Recently Opened Positions with Returns
- All Open Positions by Sector with Returns
- Outlook
- Foreshadowing Potential Trades (paid section)
This layout maximizes transparency while keeping the foreshadowing of our potential trades within the paid section. It also loads the images together at the front, while putting the text-heavy sections together at the end.
Returns on Total Portfolio
Note: The presentation of the charts was modified slightly to enable running it through Google Sheets instead of Excel to reduce transferring data.
The chart below shows our performance since we began preparing for The REIT Forum at the start of 2016 through the end of the latest month:
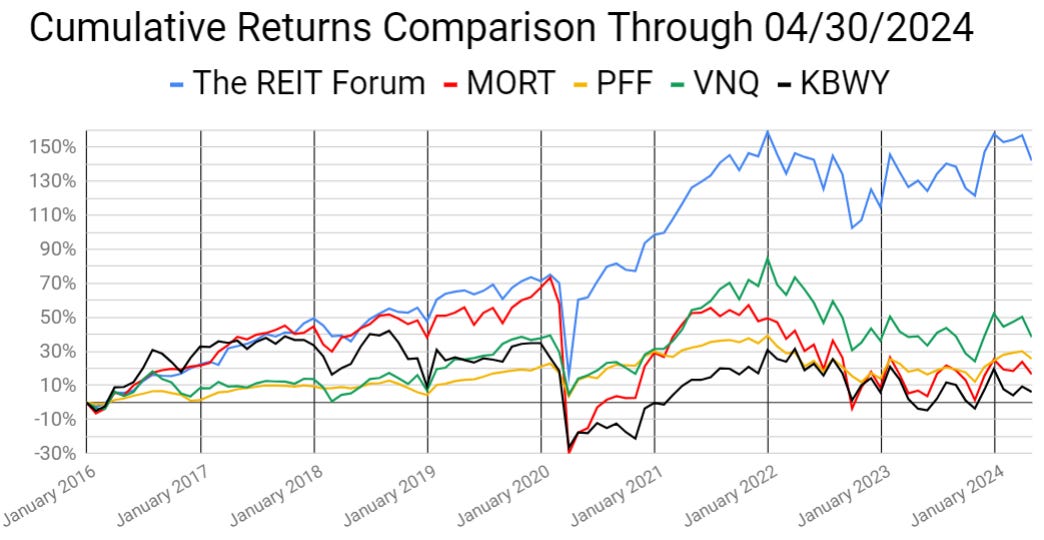
There are four major index ETFs we use for evaluating performance. They are:
- (MORT) $MORT - Major mortgage REIT ETF
- (PFF) $PFF - The largest preferred share ETF
- (VNQ) $VNQ - The largest equity REIT ETF
- (KBWY) $KBWY - The high-yield equity REIT ETF most retail investors follow
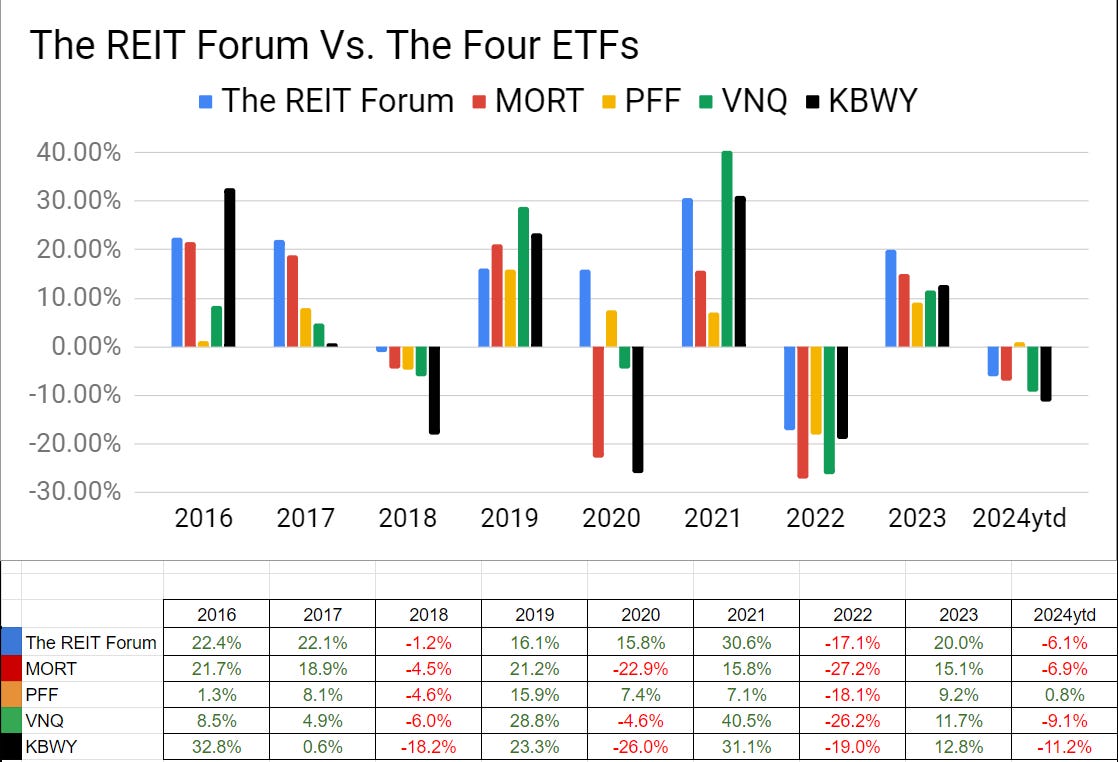
Annual comparison vs. each ETF:
Our performance vs. the average of the ETFs:
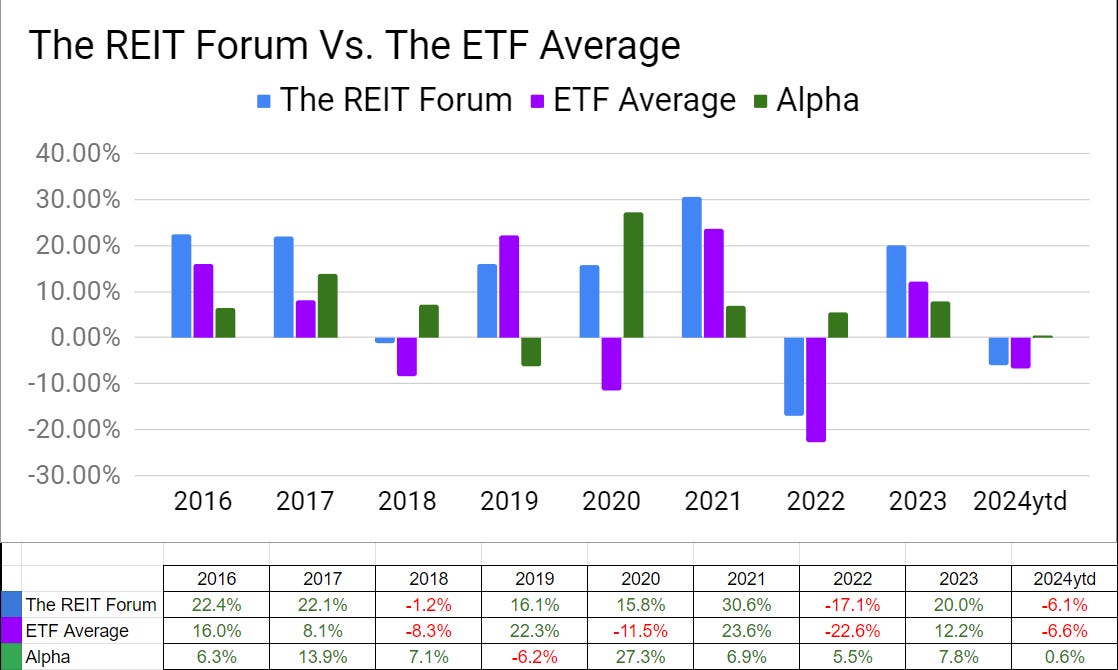
We evaluate alpha based on performance against the ETFs because it strips out the general change in our sectors.
The next chart shows the change in the value of our portfolio from month to month. We strip out the impact from contributions made during the month because, obviously, contributions are not returns.
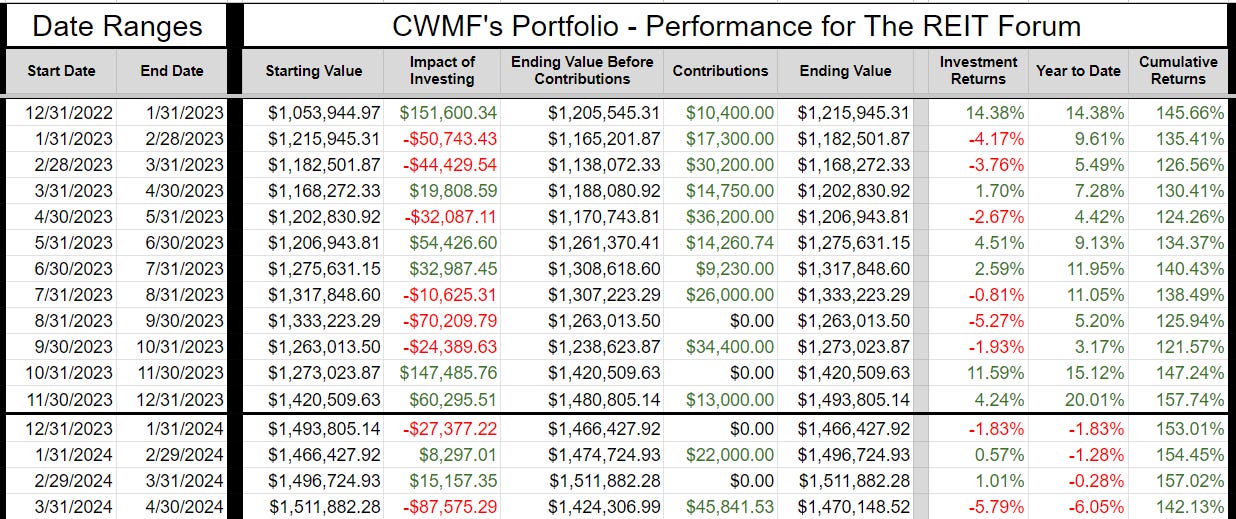
The prior year is included as well to help investors see how the calculations work.
If anyone is confused by these calculations, let me know. I believe this transparency is crucial, so I’ll include an example showing every calculation if I hear that readers have any difficulty following it.
Sector Allocation Chart -
The sector allocation chart helps to explain how we are thinking about risk and seeking returns:
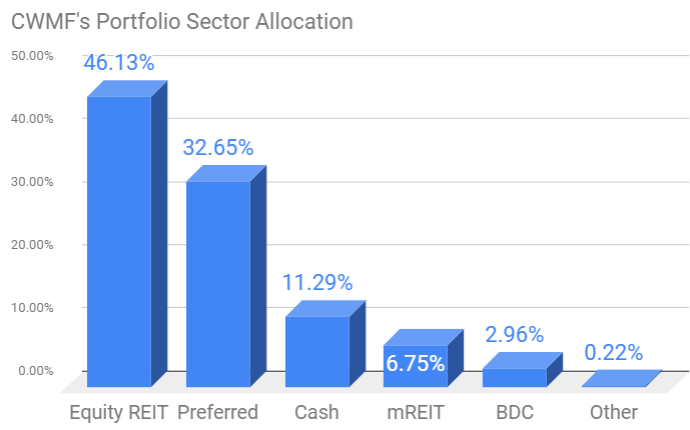
Equity REIT allocation fell from 47.55% to 46.13% despite adding $45,851.53 and spending it on equity REITs. It was a really rough period for large REITs. Especially for large REITs with a strong history of growth in AFFO per share.
Reminder About Cash (repeated)
I normally keep at least 6 months or more of living expenses in “cash”. If you normally keep around $40k to $50k in “cash”, the difference between getting paid 5% and 0.2% is around $2k per year.
I’m using (SGOV), (SHV), and (BIL) as my cash substitutes. These are short-term Treasury ETFs. Prices are extremely stable. Liquidity is excellent.
I use a Schwab business account that is not part of my portfolio. The only assets it holds are actual cash and cash substitutes (those 3 ETFs).
Nearly all my expenses go through my credit card already (paid off in full each month).
I still have my checking through USAA because of the long history on those credit cards. If I need cash, I can sell Treasury ETFs and transfer the funds to my USAA account.
It takes a few days, but that’s fine.
This is a pretty nice return for cash I was going to have there anyway.
Note: Some people think you don’t need a strong credit score after getting a mortgage. I disagree. The long history on those cards is extremely useful if I want to boost someone’s credit score. If I add someone to my card, their next update will show they have a card with 20 years of perfect history.
You can get scammed this way. You are liable for the bill. They can just charge the card and walk away. This doesn’t concern me because I keep a lower limit (such as $10k) on those cards and I’m only doing it for people I trust. If one of those people betrays me, I’ll count myself lucky that I found out for only $10k. For people who can’t afford to risk that money, this would be too dangerous.
Housekeeping
We used to have a repeated section on strategy, but I wanted to shorten the update.
I’ll be posting an article that covers our strategy in greater depth and just adding a link to that post.
Recently Closed Positions with Returns
These are the positions closed during the prior calendar month. If you want to see positions that were closed before that, you can see the prior portfolio updates or use the Google Sheets.
If we didn’t close any positions for the sector during the month, then the image will be blank.
Note: By loading the Google Sheets, you can still see all of our closed positions. We only include the recently closed positions to reduce the size of the article:
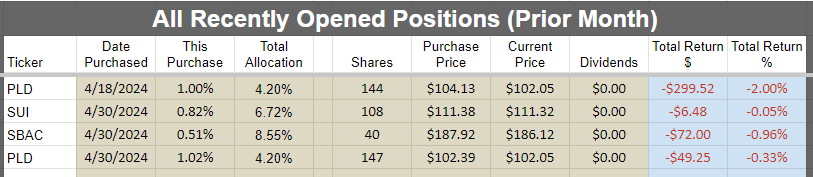
Recently Opened Positions with Returns
All Open Positions by Sector with Returns
We will start with the open positions as of the end of the month. It often takes a few days to prepare this article, but the screenshots below are from the end of the prior month.
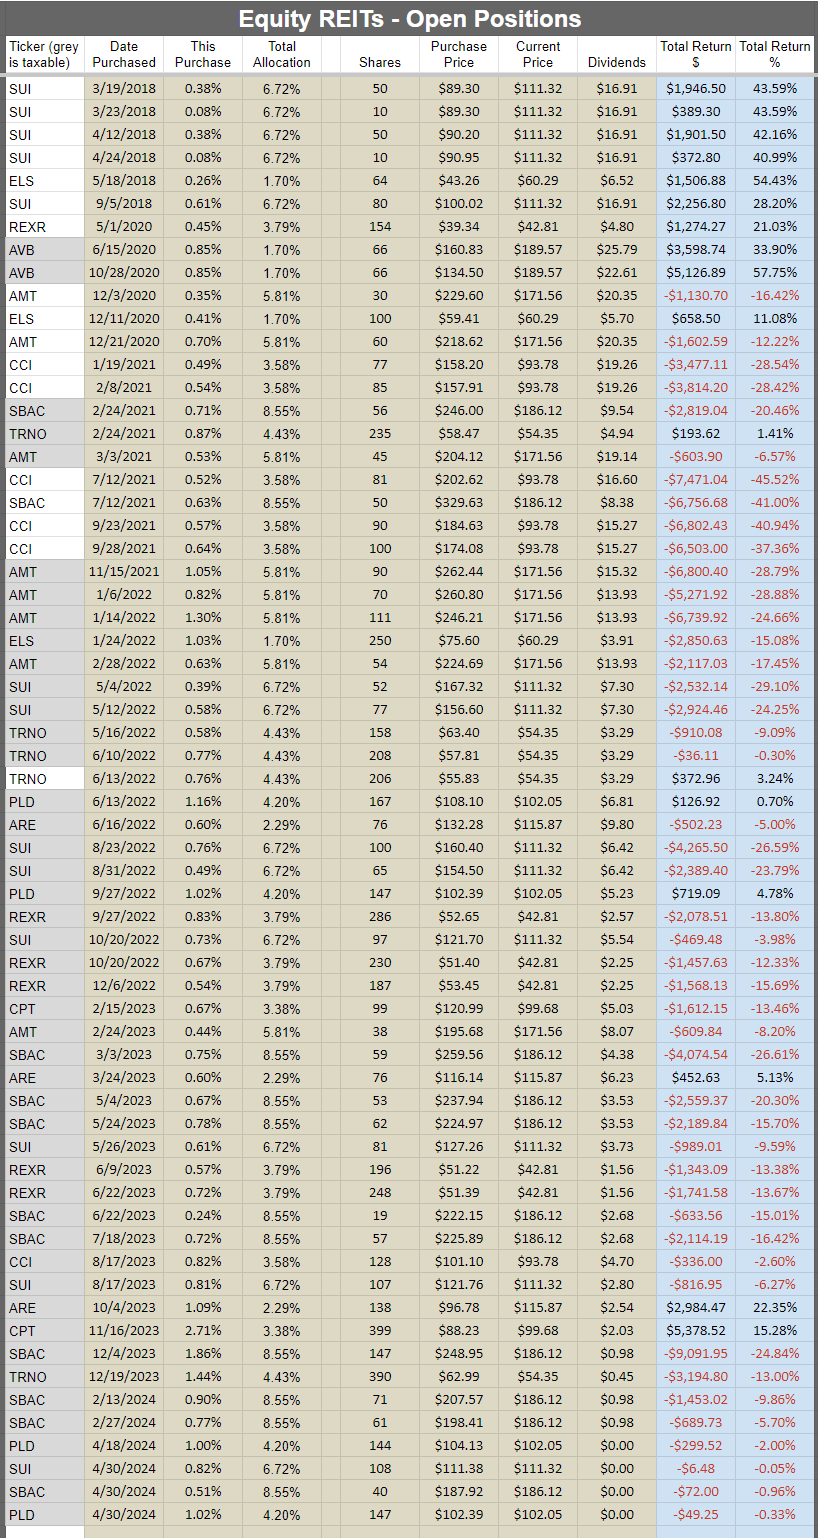
The cell with the ticker is grey if the position is in a taxable account. This was a request by a few members and there was no drawback to adding the information. All of those positions are in equity REITs.
Preferred shares and baby bonds:
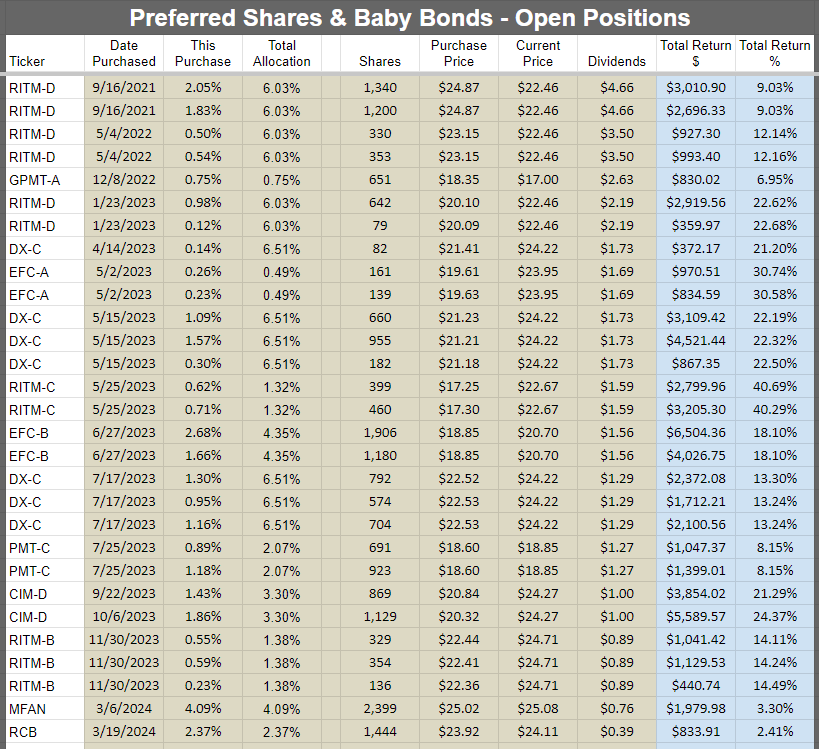
Note: Subsequent to the end of the month, we sold our positions in RITM-C and used the proceeds to purchase additional shares of RITM-D.
Equity REITs:
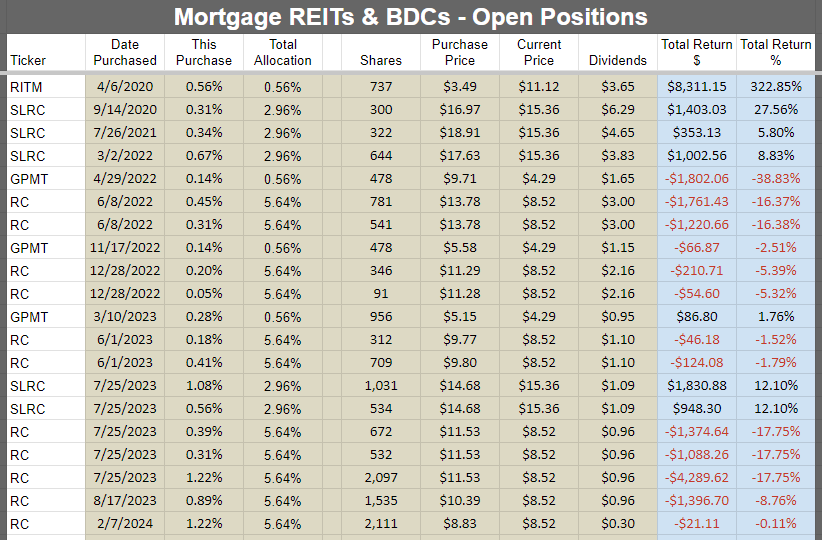
Mortgage REITs and BDCs:
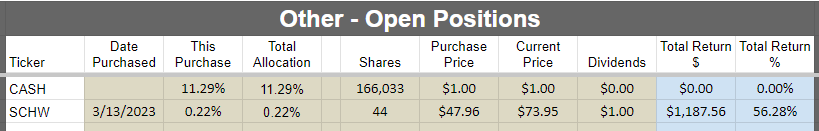
Other:
Subsequent Changes
None so far.
Outlook
I’m still maintaining some caution as evidenced by the cash allocation still over 10%.
I’ll be hunting for the preferred share opportunities (including swapping positions) and looking for potential opportunities in baby bonds.
We picked up quite a bit of equity REITs during April with our 4 purchases.
Note on target updates:
- Target updates are a constant process. Swings in interest rates, positive or negative developments, and new research can all push targets higher or lower.
- Preferred share targets update daily for dividend accrual and drop on ex-dividend dates. We also adjust targets for swings in interest rates and risk levels.
Foreshadowing Potential Trades
This section is usually prepared shortly before publishing. The goal is to quickly cover ideas for trades. We aim to foreshadow our trades here, though the market may move in surprising ways. While the article takes days to prepare and documents prices and performance from the end of the month, the potential trades section is written last to provide the most up-to-date pricing.
Based on the change in relative prices as of 05/14/2024 to 05/15/2024 here are some of the trades on my radar.
Note: The section below took two days to prepare because of the fundamental research I was doing while preparing it.
Paid Section Begins
Foreshadowing potential equity REIT trades
Industrial: In the prior update, I referenced that I was still looking at Prologis (PLD) and may increase the position further. We did that. Shares were falling at the end of April and I wanted to get those trades in before the next month began. Our thesis for the long-term performance of industrial REITs remains solid. If I add to any equity REIT positions, the most likely segment is industrial REITs.
Housing:
Mid-America Apartment Communities (MAA) could still be interesting as a long-term play. However, we’re not going to jump in for fear of missing out. Shares have underperformed other apartment REITs, but still remain over 16% above their lows. The end of the excess supply should be positive. I’m not hearing much yet about the cases against landlords for using RealPage. RealPage is a software service for pricing apartments. The problem is that it is built by pulling data from all landlords and requiring landlords to follow the “suggested” prices. The impact on market rents is very similar to what would happen if landlords were colluding to raise rents.
There are many cases open against RealPage. I doubt RealPage will succeed in arguing that it isn’t collusion simply because there is a computer doing it. Not a lawyer or judge, but this seems like a pretty obvious case.
There’s a chance of headlines driving prices lower, so I remain patient awaiting opportunities.
To be fair, if RealPage is completely eliminated, it could have a material impact on rental rates.
Without landlords being compelled to match the RealPage pricing suggestion, more landlords might compete on price.
Towers:
We ended up buying more SBA Communications (SBAC) $SBAC at the end of April. The tower position is already huge, so I’m cautious about raising it.
I still find the towers attractive though. Customers demand faster data. However, high rates are a big headwind.
Other: No other equity REITs on my radar at the moment.
Foreshadowing potential BDC trades
Depends on valuation. SLR Investment Corp. (SLRC) could cross out of the “buy under” range for the first time in a very long time. I would consider taking some gains off the table, but there’s nothing else in that segment in the target range for redeploying. That makes it a bit harder since I like maintaining a moderate allocation.
Foreshadowing potential mortgage REIT trades:
Same as last month: “Check the weekly updates. There are quite a few things in our target ranges. If Scott opens or increases a position I may follow him in. I would still prefer to be playing with the agency mortgage REITs over the hybrid mortgage REITs. But the market refuses to put the agency mortgage REITs at significant discounts. Well, it refuses to put the better ones at significant discounts to book value. The ones that do trade at lower price-to-book ratios are ones we already identified as mortgage REITs that should trade at lower ratios.”
Foreshadowing potential preferred share or baby bond trades:
First, I want to reference GPMT-A (GPMT.PR.A). Granite Point Mortgage Trust (GPMT) delivered a bad first quarter result. Significantly worse than expected. Common share risk ratings increased and targets decreased. Based on their dreadful Q1 2024 result, I anticipate a further reduction in preferred share targets and a preferred share risk-rating adjustment to 5.5. Prior adjustments were before the Q1 2024 result. Management’s weak performance is a concern. When management significantly underperforms Scott’s projection, it reflects management doing a weak job.
Note: Common shares already have a common share risk rating of 5.5. A preferred share risk rating of 5.5 is lower than a common rating of 5.5, but it emphasizes that these shares remain high risk.
The coverage ratio using the book value of common equity is still acceptable. However, as a commercial mortgage REIT, they are not compelled to market assets to market when they intend to hold the asset to maturity and believe they may be repaid in full. That’s fine in short-term scenarios. However, it can be a challenge with loans that have extended maturities. For instance, you probably wouldn’t loan money to a developer at SOFR +3% today unless your position was extremely strong (near zero credit risk).
Consequently, I believe the coverage ratio in a liquidation would be much lower than implied by the book value of common equity. Of course, this is reflected by common share targets including a massive discount to book value.
Earnings for common shareholders, excluding the impact of reserves for losses, were still weak because so many loans were on nonaccrual status. Since the REIT is not recognizing revenue from those loans, it significantly reduces total revenues for the period. That leads to a lower yield on assets, a lower net interest spread, and a reduction in net interest income.
On average these loans are recorded at about 75% of face value (actual debt outstanding). If management could resolve these loans for 75% of face value in cash, it would allow them to pay down debts and dramatically improve net interest income. However, if I were on the board, I would be looking for ways to unload the entire company to an entity with better financing and more expertise.
The silver lining may be that the weighted average fully-extended remaining term continues to decrease. Every time a loan gets repaid at face value it improves the situation for both common and preferred shareholders.
My current position in GPMT-A is pretty small. Less than 0.7% of the portfolio. I think that’s a reasonable level given the high risk.
If GPMT-A was floating today, the coupon rate would be around 11.4%. That’s a big coupon, but I think investors would still demand a higher yield. Consequently, I think shares would still trade materially below $25.00. That means the yield to call is probably too optimistic. I think the required floating yield would be at least 13.5%, but probably under 15%. However, investors have to wait until early 2027 for the floating rate.
Next position:
CIM-D is trading at $24.67. This puts shares at 101.9% of our target. The first floating-rate ex-dividend date is coming up soon. I might look to pocket the gains on this position. I haven’t decided if I’ll try to do it before or after the ex-dividend date. If I wait until after, I would be fine with a lower price (since I pocket the dividend). The actual dividend payment might help some tools recognize the new yield. My experience is that generally investors will often undervalue the dividend accrual, so that would be an incentive to wait for early June. But it will come down to pricing. CIM-C has actually done quite well recently also. It seemed like it might take longer to rally since the floating date is further in the future, but some investors have been jumping in.
Next position:
I’m thinking about going back into PMT-B (PMT.PR.B). This is one of the shares we marked as “fixed-to-lawsuit”. PennyMac (PMT) management has not yet announced any change in their plans to violate the LIBOR act. In the next week or so, they should make an announcement regarding PMT-A. Based on their Q1 2024 10-Q, they still believe they can get away with fixing the rate. They might get away with it, but as we covered previously, they will be in violation of their own contract when they make the next payment on PMT-A. PMT-A began floating 3/15/2024 and PMT-B will begin floating 6/15/2024 per the contract. Therefore, PMT-A’s dividend should be declared at the floating rate. However, it is very unlikely that management will admit their “mistake” until they face pressure to do so. If I do this, I may also close out my position in PMT-C (PMT.PR.C). PMT-C is a fixed rate share. At $19.30, the stripped yield is 8.91%. PMT-B is at $23.40 (less upside) and the stripped yield is lower (8.7%), but if the shares eventually float, it would most likely push the price above $25.00 or trigger an immediate call.
Management could call the shares to mostly mitigate the situation. However, they would still need to take on new financing at slightly higher rates.
Another Note:
There are SEVEN preferred shares currently triggering the “overpriced” rating. That’s amazing after the weakness we saw in prior years.
MFA-B ($20.67) just entered that territory. The stripped yield is 9.24%. The yield to maturity on their baby bond (MFAN) is 9.05%. That’s a spread of only 0.19%.
The benefit for investors in MFA-B is the upside to call value if interest rates plunge.
That spread is tighter than it is for other combinations of fixed-rate preferred shares and baby bonds.
PMT-C ($19.30) has an 8.91% stripped yield. The baby bond (PMTU) has an 8.5% yield to maturity. That’s a 0.41% spread and PMT-C has a larger potential gain if investors want to gamble on rates falling.
RC-E ($18.35) has an 8.96% stripped yield. The baby bonds (RCC) and (RCB) have yields to maturity at 8.44% and 8.38%. So RC-E has a spread greater than 0.5% and the most upside to call value.
Consequently, I find it interesting that anyone would use MFA-B to speculate on rates falling. They could use PMT-C or RC-E for that speculation. If they wanted yield, MFAN would give them enough.
Full list of the 7 overpriced preferred shares: NLY-G, EFC-D, MFA-B, IVR-B, IVR-C, CHMI-A, CHMI-B.
Conclusion
Thanks for reading. I hope you find the ideas in this article helpful as you navigate the markets.
I apologize in advance for any typos. With such a large document, it is extremely common to have at least one or two. If you’re reading this more than a day after it’s been published, check the comments section for any corrections.
Member discussion