

Camden Property Trust Q4 2023 Update
Camden Property Trust Q4 2023 Update
By Colorado Wealth Management Fund

Camden Property Trust (CPT) CPT 0.00%↑ is projecting negative growth in Core FFO per share and flat growth in same property net operating income
Is this surprising? No.
We’ve been forecasting weaker leaser spreads to drive lower SS NOI and resulting weakness in Core FFO per share. We saw this dating back to before CPT’s share price peaked at the end of 2021.
We couldn’t predict the magnitude of the decline in share prices, but we could predict that CPT’s massive growth rate for SS NOI and all FFO per share metrics would plunge.
They had to plunge because there was no way rental rates could continue to compound at such a high rate. Rent prices cannot compound significantly faster than wage growth indefinitely because apartments need tenants who can pay the rent.
Further, we knew that there was a surge in apartment development in response to low interest rates.
Core FFO Per Share
2023: $6.92
2024 Guidance midpoint: $6.74
Range: $6.59 to $6.89
Same Property Net Operating Income
This is often listed as SS NOI (same-store net operating income). I will regularly refer to it as SS NOI.
SS NOI projected growth rate: -1.5% to 1.5%
Midpoint: 0.0%
Why Supply Happened
Actual price increases for rent, goods, and services were growing at over 10% annually during 2021. Meanwhile, short-term interest rates were still under 1%. Consequently, the real interest rate was dramatically negative. It isn’t unusual to see negative real interest rates in the negative 0.1% to negative 2.5% range. Real rates that are negative by more than 9% are extremely unusual.
Investors reacted by looking for ways to create long-term inflation hedges. Apartment rents create a great long-term inflation hedge. Consequently, apartment building prices were going up and development looked quite profitable. A large volume of new projects were started. As those projects are completed, it creates new vacancies in the local markets and that puts pressure on rents.
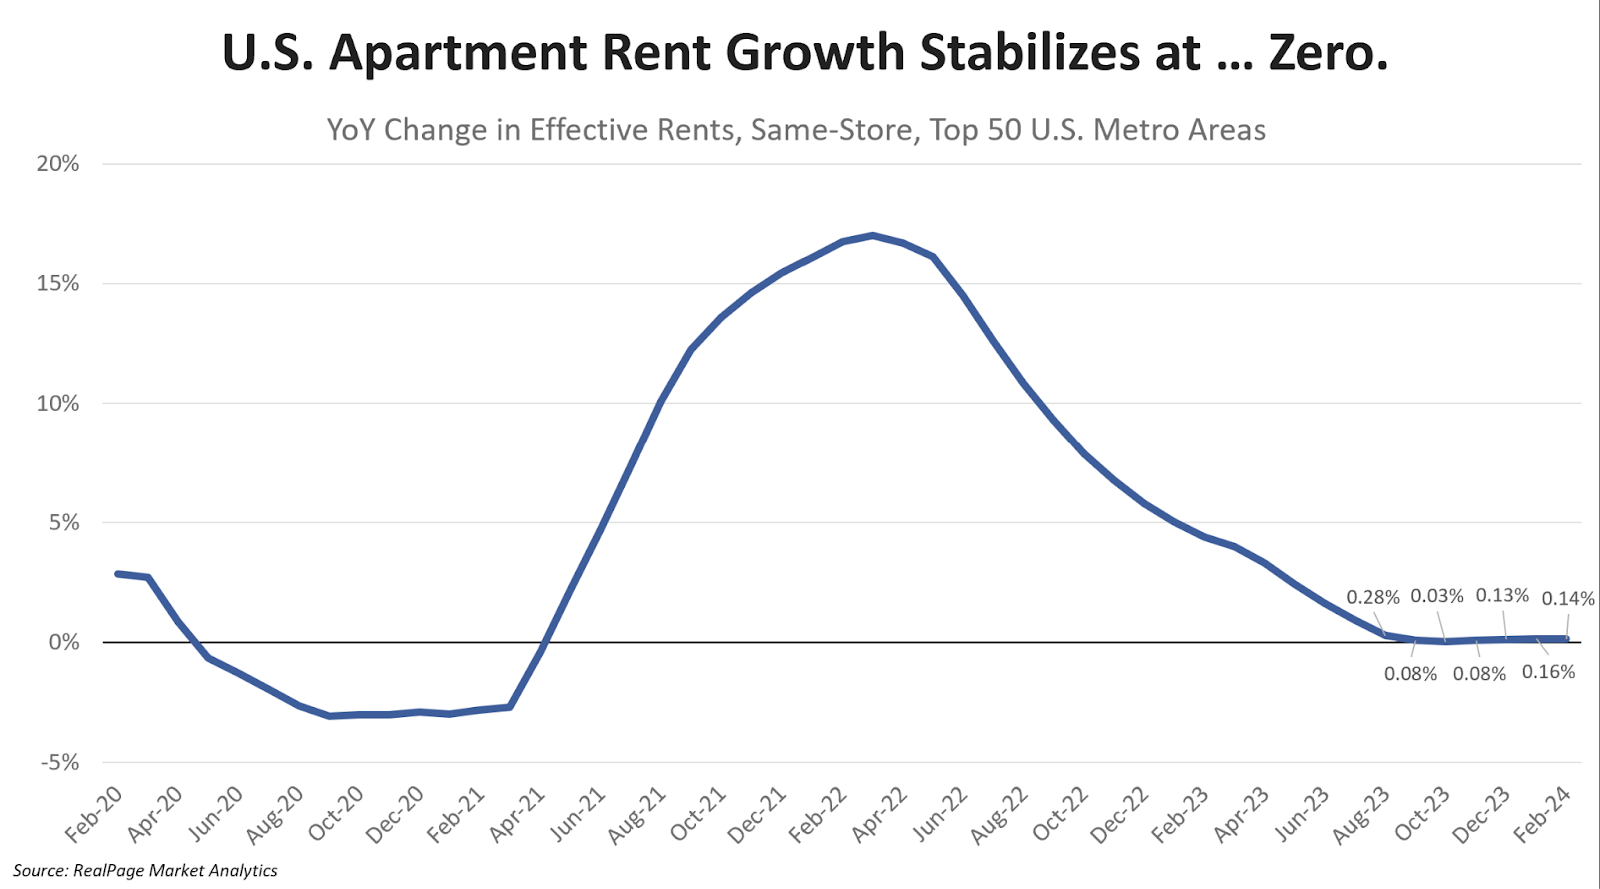
Apartment Rent Stabilized
While CPI Shelter continues to run hot (lagged data), the actual rent growth across the major metros is roughly flat. Year-over-year changes have been between 0.3% and 0.0% for the last 7 months:
CPT is actually projecting revenue growth to be a bit stronger for their communities, though NOI growth is projected to be flat.
Same property revenue: 0.5% to 2.5%
Same property expenses 3.75% to 5.25%
Same property NOI: -1.5% to 1.5%
Why are expenses growing faster? Expect that to happen quite a bit. There can be a lag time for tax and insurance, which creates a headwind for expenses. We highlighted that well in advance also. No surprise there.
Leasing Spreads Show Up First
Leasing spreads are a leading indicator of REIT performance.
The following chart demonstrates the leasing spreads and vacancy rate for CPT by quarter: